
Page 242 - Excel Data Analysis
P. 242
12 537547 Ch11.qxd 3/4/03 12:48 PM Page 228
EXCEL DATA ANALYSIS
COMPARE THE VARIANCES
IN TWO GROUPS OF DATA
f you want to compare the variances between two groups to the MS within the groups. If the F statistic is less
groups of data, you can use the F-Test Two-Sample for than the F Critical value, you cannot reject the null
I Variances tool in Excel. Variance is a measurement how hypothesis that the variances of the two groups are the
a group of values disperse around the group's mean value. same. An F statistic close to 1 indicates that two groups
For example, you may have two plants producing the same have equal variances.
product, one in Indiana, and one in Texas, and both have To perform this test, you must provide Excel with the ranges
efficiency levels of 95%, but you want to know which plant of both data groups as well as an Alpha level, or the
more consistently remained efficient throughout the year. statistical confidence level you expect. The Alpha field is the
When you calculate the variance of both plant's efficiency probability of H being true. You specify a value between 0
A
values, you may find that the Indiana plant has a lower and 1 for the confidence level. The default level of .05 is
variance than Texas, therefore more efficiently performed equivalent to a 95-percent confidence level. To make your
throughout the year.
table easily identifiable, you can let Excel know that you
When you use an F-test analysis, Excel compares the ratio have labels in the first row of your worksheet. For more on
of the variance between each data group. Excel calculates comparing two groups of data, and on how to set up
an F statistic (F) for the two sets of data, which is the ratio statistical hypotheses (H true and H ) see the section
0
A
of the Mean Standard Square Error (MS) between the "Analysis of Variance for Lists of Values (ANOVA)."
COMPARE THE VARIANCES IN TWO GROUPS OF DATA
F-Test Two-Sample for Variances
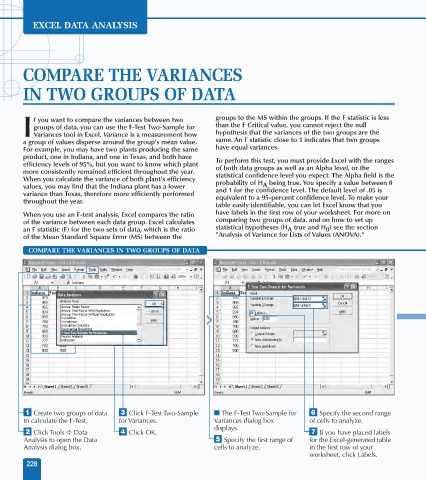
⁄ Create two groups of data ‹ Click F-Test Two-Sample ■ The F-Test Two-Sample for Á Specify the second range
to calculate the F-Test. for Variances. Variances dialog box of cells to analyze.
displays.
¤ Click Tools ➪ Data › Click OK. ‡ If you have placed labels
Analysis to open the Data ˇ Specify the first range of for the Excel-generated table
Analysis dialog box. cells to analyze. in the first row of your
worksheet, click Labels.
228