
Page 245 - Excel Data Analysis
P. 245
12 537547 Ch11.qxd 3/4/03 12:48 PM Page 231
USING THE ANALYSIS TOOLPACK ADD-INS 11
When you use the Moving Average tool, Excel uses the AVERAGE
function to determine each moving average value. The first few
values in the column contain the value #N/A. The number of cells
that contain #N/A is one less than the integer value specified for the
Interval value. For example, if the specified interval is 3, the first two
cells in the Moving Average column contain the value #N/A because
you do not have three values to average.
When you create a chart for the Moving Average, Excel automatically
uses default labels for each data series, the axes, and the chart title.
You can use the chart options to change the text of each label.
To change the text of the chart title and axes labels, click Chart ➪
Chart Options to display the Chart Options dialog box. Click the
Titles tab and specify the desired labels.
To change the data series labels displayed in the legend, click
Chart ➪ Source Data and click the Series tab. Click each series and
specify the desired name. You can either type a name or specify the
reference of a cell containing a label. For more about Excel charting
functions, see Chapter 6.
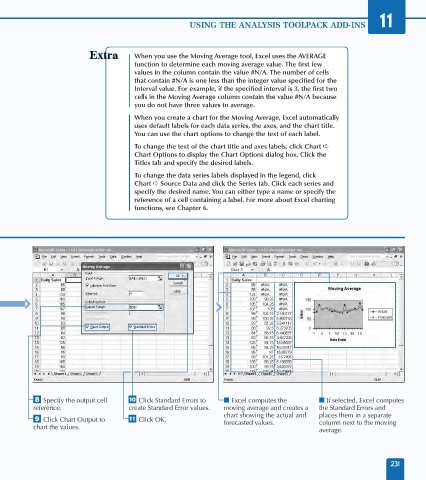
° Specify the output cell ‚ Click Standard Errors to ■ Excel computes the ■ If selected, Excel computes
reference. create Standard Error values. moving average and creates a the Standard Errors and
chart showing the actual and places them in a separate
· Click Chart Output to — Click OK. forecasted values. column next to the moving
chart the values.
average.
231