
Page 241 - Excel Data Analysis
P. 241
12 537547 Ch11.qxd 3/4/03 12:48 PM Page 227
USING THE ANALYSIS TOOLPACK ADD-INS 11
When you use the Descriptive Statistics tool, Excel calculates several values:
STATISTIC DESCRIPTION
Mean The average value, or center of the distribution, of the data group.
Standard Error The square root of the sample size (n) divided into the standard deviation over
the square root of the sample size (n).
Median The middle value in the group of data.
Mode Most common value in the group of data.
Standard Deviation The dispersion of the group of data values.
Sample Variance The Standard deviation squared, or the measure of the dispersion of the data.
Kurtosis The direction of the curvature of the underlying distribution.
Skewness The degree of symmetry in distribution around a central axis.
Range Difference between the largest and smallest values.
Minimum/Maximum Smallest and largest values in the group.
Sum Total when all values are added for the group.
Count Number of values in the group.
Largest(N)/Smallest(N) The largest and smallest value in the group, where N is a specified integer.
Confidence Level How much your value deviates from the mean.
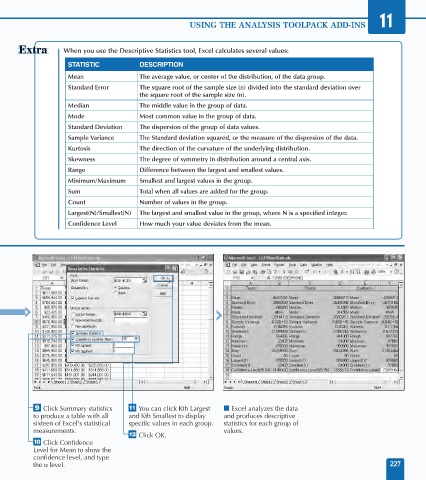
· Click Summary statistics — You can click Kth Largest ■ Excel analyzes the data
to produce a table with all and Kth Smallest to display and produces descriptive
sixteen of Excel's statistical specific values in each group. statistics for each group of
measurements. values.
± Click OK.
‚ Click Confidence
Level for Mean to show the
confidence level, and type
the level. 227