
Page 238 - Excel Data Analysis
P. 238
12 537547 Ch11.qxd 3/4/03 12:48 PM Page 224
EXCEL DATA ANALYSIS
DETERMINE THE COVARIANCE
OF TWO SETS OF DATA
ovariance calculates the average of the product of have the data sets grouped. You can make the output easier
deviations of values from the means of each data to identify by opting to have results and labels in the first
C set. If you plot your data and observe a straight line row of your worksheet.
using Excel's XY (Scatter) chart, you can statistically prove Excel creates a table showing the covariance value between
that a relationship exists by calculating the correlation and each set of data. The covariance of a value with itself is its
covariance. Whereas a correlation determines if two sets of variance. If the covariance value is positive, the values in the
data are dependent upon each other, the covariance data sets are increasing together. If the covariance value is
determines the degree to which the two sets of data are negative, the values in the second data set tend to increase
related, or how they vary together. Once you have both the as the first data set decreases. If the covariance is zero, you
covariance and the correlation calculations, you can use cannot predict a correlation between the two data sets.
them to determine if there is, in fact, a relationship between
the two data sets. See the section "Find the Correlation To learn how to load the Covariance feature as a part of
Between Sets of Data" for more on calculating correlations, the Analysis ToolPak add-in, see the section "Install Excel
and Chapter 6 for more on plotting data. Add-ins."
To perform a covariance, you must provide Excel with the
range of cells containing the sets of data as well as how you
DETERMINE THE COVARIANCE OF TWO SETS OF DATA
Covariance
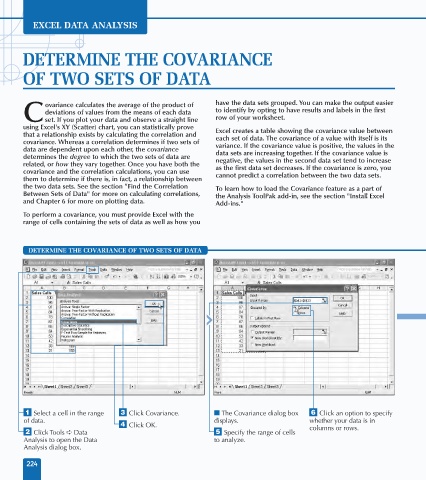
⁄ Select a cell in the range ‹ Click Covariance. ■ The Covariance dialog box Á Click an option to specify
of data. displays. whether your data is in
› Click OK. columns or rows.
¤ Click Tools ➪ Data ˇ Specify the range of cells
Analysis to open the Data to analyze.
Analysis dialog box.
224