
Page 235 - Excel Data Analysis
P. 235
12 537547 Ch11.qxd 3/4/03 12:48 PM Page 221
USING THE ANALYSIS TOOLPACK ADD-INS 11
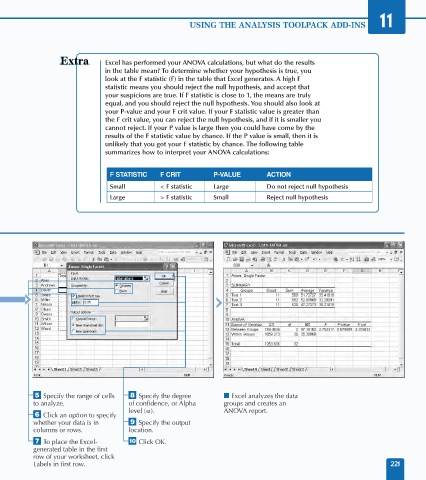
Excel has performed your ANOVA calculations, but what do the results
in the table mean? To determine whether your hypothesis is true, you
look at the F statistic (F) in the table that Excel generates. A high F
statistic means you should reject the null hypothesis, and accept that
your suspicions are true. If F statistic is close to 1, the means are truly
equal, and you should reject the null hypothesis. You should also look at
your P-value and your F crit value. If your F statistic value is greater than
the F crit value, you can reject the null hypothesis, and if it is smaller you
cannot reject. If your P value is large then you could have come by the
results of the F statistic value by chance. If the P value is small, then it is
unlikely that you got your F statistic by chance. The following table
summarizes how to interpret your ANOVA calculations:
F STATISTIC F CRIT P-VALUE ACTION
Small < F statistic Large Do not reject null hypothesis
Large > F statistic Small Reject null hypothesis
$B$1:$D$12
ˇ Specify the range of cells ° Specify the degree ■ Excel analyzes the data
to analyze. of confidence, or Alpha groups and creates an
level ( ). ANOVA report.
Á Click an option to specify
whether your data is in · Specify the output
columns or rows. location.
‡ To place the Excel- ‚ Click OK.
generated table in the first
row of your worksheet, click
Labels in first row. 221