
Page 237 - Excel Data Analysis
P. 237
12 537547 Ch11.qxd 3/4/03 12:48 PM Page 223
USING THE ANALYSIS TOOLPACK ADD-INS 11
When you use the Correlation tool, Excel calculates the correlation
values based upon the current sets of data. If you alter a value in a
data set after computing the correlation, Excel does not update the
calculated values. You need to recalculate the Correlation again to
update the values.
If you want to modify the data values and have Excel automatically
update the Correlation value, you must use the CORREL function to
create a formula. With this function, you can examine the values in
two different lists and determine the correlation. The CORREL
function has two arguments:
=CORREL(Array1, Array2)
For each argument you must specify the range of cells containing the
values you want to compare. The CORREL function returns a value
between –1 and 1 indicating the correlation between the two sets of
data values.
If you want to compare multiple sets of data values, you must create a
separate CORREL formula each time you want to compare two sets.
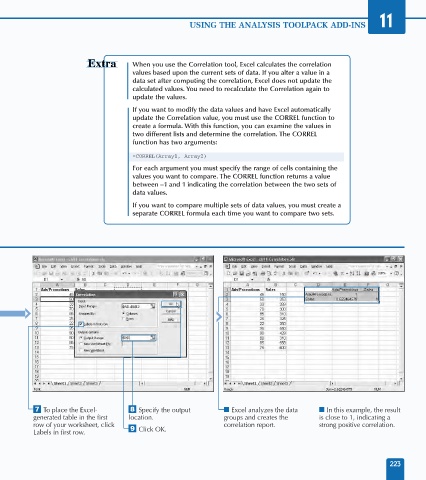
‡ To place the Excel- ° Specify the output ■ Excel analyzes the data ■ In this example, the result
generated table in the first location. groups and creates the is close to 1, indicating a
row of your worksheet, click correlation report. strong positive correlation.
Labels in first row. · Click OK.
223