
Page 239 - Excel Data Analysis
P. 239
12 537547 Ch11.qxd 3/4/03 12:48 PM Page 225
USING THE ANALYSIS TOOLPACK ADD-INS 11
If you just want to return a single covariance values for both arguments, or the function returns
value for two sets of data values, you can use the an error. Excel ignores any cells containing text,
COVAR function available within Excel to create logical values, or empty cells.
a formula in the appropriate cell. When you use
the COVAR function, it determines the If you want to compare multiple sets of data values,
covariance of the two sets of data by finding the you must create a separate COVAR formula each
average of the product of the deviations time you want to compare two sets. For example, if
between all possible pairs of values within the you want to compare sets A, B, and C, you must
sets. The function treats each set of values as create three different formulas so that you compare
separate arrays. A to B, A to C, and B to C.
The COVAR function requires two arguments, as
shown in the following syntax:
=COVAR(Array1, Array2)
For each argument you need to specify the range
of cells containing the values you want to
compare. You must specify the same number of
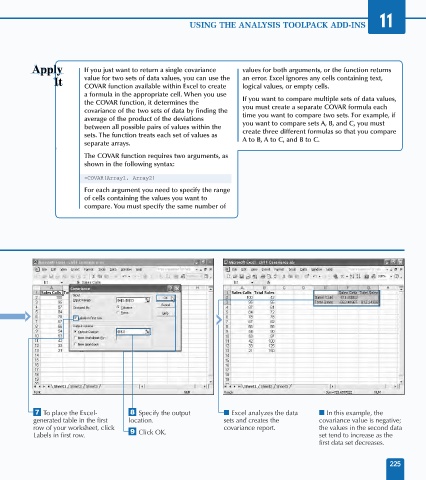
‡ To place the Excel- ° Specify the output ■ Excel analyzes the data ■ In this example, the
generated table in the first location. sets and creates the covariance value is negative;
row of your worksheet, click covariance report. the values in the second data
Labels in first row. · Click OK. set tend to increase as the
first data set decreases.
225