
Page 244 - Excel Data Analysis
P. 244
12 537547 Ch11.qxd 3/4/03 12:48 PM Page 230
EXCEL DATA ANALYSIS
CALCULATE A MOVING AVERAGE
ou can smooth out a data series that contains a lot of Unlike other tools available for Data Analysis, the Moving
variability using Excel's Moving Average Tool. You Average tool can only output the values to the current
Y might do this if you analyze a large amount of data worksheet. You need to specify the first cell you want to use
that occasionally has peaks that do not represent the data for the results. Keep in mind, if the first row contains a
as a whole. For example, if you collect data on the daily label, you want the data values to start in the second row.
sales of an item, but your data occasionally includes "spikes" You have the option of creating a line chart that shows the
when you promoted the item, or placed it on sale, you might relationship between the actual values in the data set and
perform a moving average to calculate a more accurate the forecasted moving average that the Moving Average
average — without including the sale promotion spikes. tool creates. If you select this option, Excel places the chart
Using a moving average, you can often spot trends in data in the same worksheet as the moving average values.
that are not obvious in the raw data values.
Excel provides the Moving Average tool as part of the
You specify the number of values, or Intervals, Excel should Analysis ToolPak add-in option that you can load on the
use to calculate the moving average. If you omit an Interval Add-Ins dialog box. See the section "Install Excel Add-Ins"
value, Excel uses a default value of 3, which means that the for more information on loading add-in options.
moving average is calculated by averaging the last three
values.
CALCULATE A MOVING AVERAGE
Moving Average
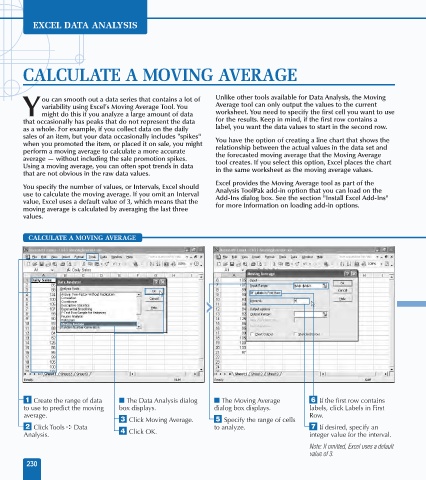
⁄ Create the range of data ■ The Data Analysis dialog ■ The Moving Average Á If the first row contains
to use to predict the moving box displays. dialog box displays. labels, click Labels in First
average. Row.
‹ Click Moving Average. ˇ Specify the range of cells
¤ Click Tools ➪ Data to analyze. ‡ If desired, specify an
Analysis. › Click OK. integer value for the interval.
Note: If omitted, Excel uses a default
value of 3.
230