
Page 243 - Excel Data Analysis
P. 243
12 537547 Ch11.qxd 3/4/03 12:48 PM Page 229
USING THE ANALYSIS TOOLPACK ADD-INS 11
When you use the F-Test Analysis tool, Excel calculates several
values, as described in the following table.
STATISTIC DESCRIPTION
Mean The average value, or center of the distribution, of the data group.
Variance A measurement of the spread or dispersion of the data. The average squared
distance between each datum & the mean.
Observations Indicates the number of values in each list.
df Indicates the Degrees of Freedom, or the number of values that are free to vary
after a statistic has been computed from a set of data.
F The ratio of the variance of the individual groups to the entire range of values.
The F statistic is the ratio of the mean square between the data sets over the
mean square within the data sets.
P(F<=f) one-tail A value between 0 and 1 that indicates the probability of observing a test statistic
at least as extreme as the one observed. The closer the value is to one the higher
the probability.
F Critical one-tail The critical value of the F distribution. It is dependent on both the α level and the
degrees of freedom. It is the standard against which the F statistic is compared.
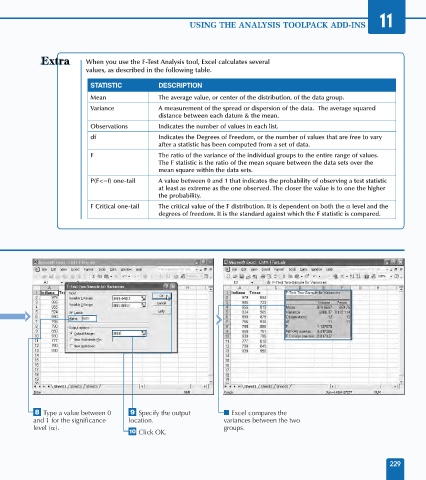
° Type a value between 0 · Specify the output ■ Excel compares the
and 1 for the significance location. variances between the two
level ( ). groups.
‚ Click OK.
229