
Page 240 - Excel Data Analysis
P. 240
12 537547 Ch11.qxd 3/4/03 12:48 PM Page 226
EXCEL DATA ANALYSIS
CALCULATE DESCRIPTIVE STATISTICS
ou can have Excel quickly calculate sixteen different indicate whether you have your sets of data grouped in
statistical measurements and summarize them in a list rows or columns. Each row or column must contain a
Y using the Descriptive Statistics tool. For an analyst, different set of data. You can make the output easier to
this feature is perfect for very quickly calculating statistical identify by opting to have results and labels in the first row
information on large databases or worksheets. When you of your worksheet.
use this tool, Excel produces a table containing standard You can use the last four options on the Descriptive
statistic calculations for each group of data values within Statistics dialog box to specify which descriptive statistics
the specified list, including the mean, standard error, values Excel calculates. Use the Summary Statistics option
median, mode, standard deviation, sample variance, to calculate all of the common descriptive statistics values.
kurtosis, skewness, range, minimum, maximum, sum, count, If you want to calculate the confidence level of the mean,
largest value, smallest value, and confidence level. For you specify the α-level. For example, 90% indicates a
example, if you use it to compare a list containing sales significance of 10%. The Kth Largest and Kth Smallest allow
amounts for different states, Excel produces a table you to find specific values in the group, such as the second
containing the statistical values related to each state.
smallest, or third largest number. If you specify a value of 1
With the Descriptive Statistics tool, you must specify the you receive the same values Excel gives you for the
range of cells containing the sets of data. You also must Minimum and Maximum values.
CALCULATE DESCRIPTIVE STATISTICS
Descriptive Statistics
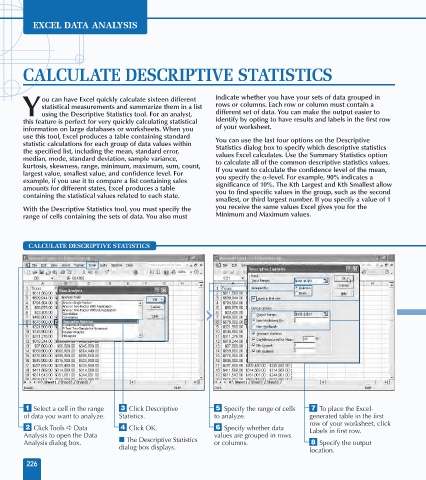
⁄ Select a cell in the range ‹ Click Descriptive ˇ Specify the range of cells ‡ To place the Excel-
of data you want to analyze. Statistics. to analyze. generated table in the first
row of your worksheet, click
¤ Click Tools ➪ Data › Click OK. Á Specify whether data Labels in first row.
Analysis to open the Data values are grouped in rows
Analysis dialog box. ■ The Descriptive Statistics or columns. ° Specify the output
dialog box displays.
location.
226