
Page 236 - Excel Data Analysis
P. 236
12 537547 Ch11.qxd 3/4/03 12:48 PM Page 222
EXCEL DATA ANALYSIS
FIND THE CORRELATION
BETWEEN TWO SETS OF DATA
ou can compare two sets of data to determine their To calculate a correlation, you must provide Excel with the
relationship using Excel's Correlation tool. If you plot range of cells for both data sets as well as how you have
Y your data and observe a straight line using Excel's XY them grouped. To make the output easier to identify, you
(Scatter) chart, you can statistically prove that a relationship may want to select the option that places your data labels in
exists by calculating the correlation and covariance. the first row of your worksheet.
Correlation, a function of covariance, determines if two sets The Correlation tool creates a table showing the degree
of data are dependent upon each other. To determine the of correlation between each group of data. The correlation
degree they are dependent, you calculate the covariance. coefficient is a value between -1 and 1. A coefficient value
You can have positively or negatively correlated data sets. of –1 denotes a perfect negative correlation, where the
For example, a positive correlation is when sales of an item values of one group increase to the same degree as the
increase due to an increase in a specific marketing activity; values in the other group decrease. With a coefficient
a negative correlation is when sales returns increase as the value of 1, you have a perfect positive correlation, where
age of a product with a short shelf life increases. For more the values of one group increase to the same degree as the
on covariance, see the section "Determine the Covariance values of the other group increase. If the correlation
of Sets of Data." See Chapter 6 for more on Excel's charting coefficient is zero, the groups of values have no relationship.
options.
FIND THE CORRELATION BETWEEN TWO SETS OF DATA
Correlation
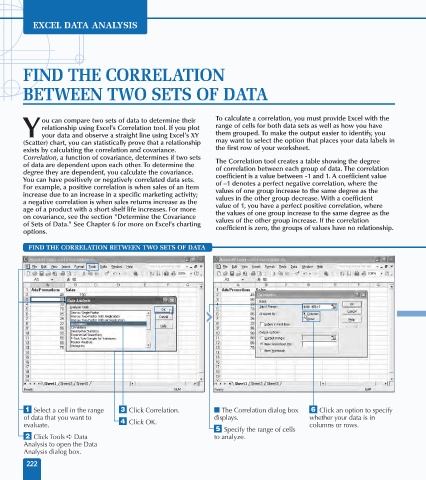
⁄ Select a cell in the range ‹ Click Correlation. ■ The Correlation dialog box Á Click an option to specify
of data that you want to displays. whether your data is in
evaluate. › Click OK. columns or rows.
ˇ Specify the range of cells
¤ Click Tools ➪ Data to analyze.
Analysis to open the Data
Analysis dialog box.
222