
Page 328 - Excel for Scientists and Engineers: Numerical Methods
P. 328
CHAPTER 13 LINEAR REGRESSION AND CURVE FITTING 305
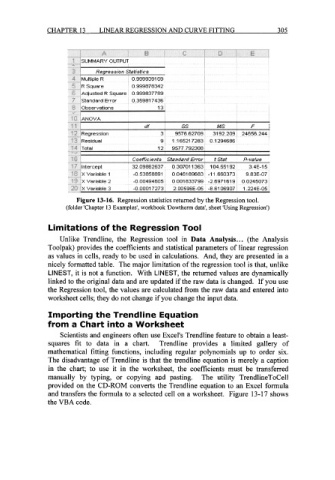
Figure 13-16. Regression statistics returned by the Regression tool.
(folder 'Chapter 13 Examples', workbook 'Dowtherm data', sheet 'Using Regression')
Limitations of the Regression Tool
Unlike Trendline, the Regression tool in Data Analysis.. . (the Analysis
Toolpak) provides the coefficients and statistical parameters of linear regression
as values in cells, ready to be used in calculations. And, they are presented in a
nicely formatted table. The major limitation of the regression tool is that, unlike
LINEST, it is not a function. With LINEST, the returned values are dynamically
linked to the original data and are updated if the raw data is changed. If you use
the Regression tool, the values are calculated from the raw data and entered into
worksheet cells; they do not change if you change the input data.
Importing the Trendline Equation
from a Chart into a Worksheet
Scientists and engineers often use Excel's Trendline feature to obtain a least-
squares fit to data in a chart. Trendline provides a limited gallery of
mathematical fitting functions, including regular polynomials up to order six.
The disadvantage of Trendline is that the trendline equation is merely a caption
in the chart; to use it in the worksheet, the coefficients must be transferred
manually by typing, or copying and pasting. The utility TrendlineToCell
provided on the CD-ROM converts the Trendline equation to an Excel formula
and transfers the formula to a selected cell on a worksheet. Figure 13-17 shows
the VBA code.