
Page 325 - Excel for Scientists and Engineers: Numerical Methods
P. 325
302 EXCEL: NUMERICAL METHODS
After formatting to show a few more decimal places, for example,
y = -1.72727E-04x3 - 4.94605E-03x2 - 5.38589E-01~ 3.20986E+01
+
you are now ready to copy the values and paste them into your spreadsheet.
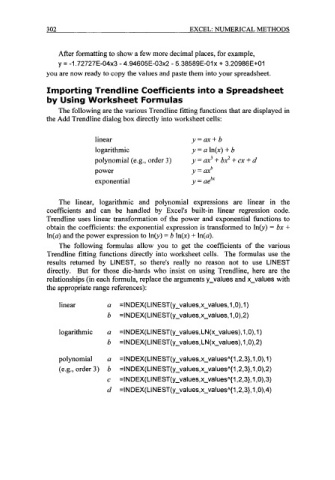
Importing Trendline Coefficients into a Spreadsheet
by Using Worksheet Formulas
The following are the various Trendline fitting functions that are displayed in
the Add Trendline dialog box directly into worksheet cells:
linear y=ax+b
logarithmic y = a In(x) + b
polynomial (e.g., order 3) y = ax3 bx2 + ex i d
power y = ax b
exponential y = aebx
The linear, logarithmic and polynomial expressions are linear in the
coefficients and can be handled by Excel's built-in linear regression code.
Trendline uses linear transformation of the power and exponential functions to
obtain the coefficients: the exponential expression is transformed to lnb) = bx +
In(a) and the power expression to Inb) = b In@) + In(a).
The following formulas allow you to get the coefficients of the various
Trendline fitting functions directly into worksheet cells. The formulas use the
results returned by LINEST, so there's really no reason not to use LINEST
directly. But for those die-hards who insist on using Trendline, here are the
relationships (in each formula, replace the arguments y-values and x-values with
the appropriate range references):
linear a =INDEX(LINEST(y-values,x-values,l ,O),l)
b =INDEX( LINEST(y-values,x-values, 1,0),2)
logarithmic a =INDEX( LI NEST(y-values, LN(x-values), 1 ,O), 1 )
b =I N D EX( LI N EST( y-values, LN(x-values) ,I ,0) ,2)
polynomial a =INDEX(LINEST(y-values,x-valuesA{l ,2,3},1 ,O),l)
(e.g., order 3) b =INDEX(LINEST(y-values,x-valuesA{l ,2,3},1,0),2)
c =I N D EX( L I N EST( y-val ues, x-valuesA{ 1 ,2,3}, 1 , 0) ,3)
d =I N D EX( LI N EST( y-val ues, x-valuesA{ 1 ,2,3}, 1 , O), 4)