
Page 323 - Excel for Scientists and Engineers: Numerical Methods
P. 323
300 EXCEL: NUMERICAL METHODS
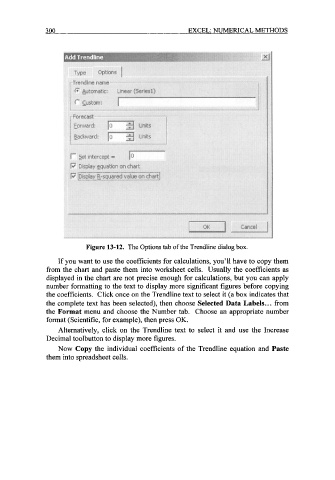
Figure 13-12. The Options tab of the Trendline dialog box.
If you want to use the coefficients for calculations, you’ll have to copy them
from the chart and paste them into worksheet cells. Usually the coefficients as
displayed in the chart are not precise enough for calculations, but you can apply
number formatting to the text to display more significant figures before copying
the coefficients. Click once on the Trendline text to select it (a box indicates that
the complete text has been selected), then choose Selected Data Labels ... from
the Format menu and choose the Number tab. Choose an appropriate number
format (Scientific, for example), then press OK.
Alternatively, click on the Trendline text to select it and use the Increase
Decimal toolbutton to display more figures.
Now Copy the individual coefficients of the Trendline equation and Paste
them into spreadsheet cells.