
Page 318 - Excel for Scientists and Engineers: Numerical Methods
P. 318
CHAPTER 13 LINEAR REGRESSION AND CURVE FITTING 295
40
20
!+
r" -
'5 0
0.
g
-- -20
N
aa
QI
i
-40
I I
-60 I I I b
0 ID 20 30 40 50 60
W0;b Ethylene Glycol
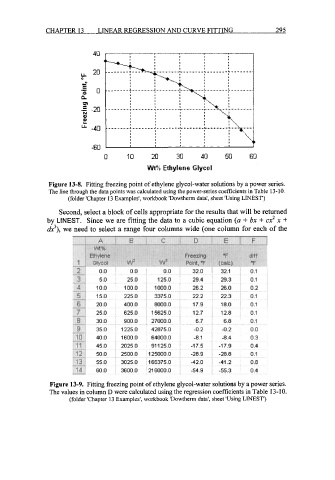
Figure 13-8. Fitting freezing point of ethylene glycol-water solutions by a power series.
The line through the data points was calculated using the power-series coefficients in Table 13-10.
(folder 'Chapter 13 Examples', workbook 'Dowtherm data', sheet 'Using LINEST')
Second, select a block of cells appropriate for the results that will be returned
by LINEST. Since we are fitting the data to a cubic equation (a + bx + cx2 x +
dx3), we need to select a range four columns wide (one column for each of the
Figure 13-9. Fitting freezing point of ethylene glycol-water solutions by a power series.
The values in column D were calculated using the regression coefficients in Table 13- 10.
(folder 'Chapter 13 Examples', workbook 'Dowtherm data', sheet 'Using LINEST')