
Page 313 - Excel for Scientists and Engineers: Numerical Methods
P. 313
290 EXCEL: NUMERICAL METHODS
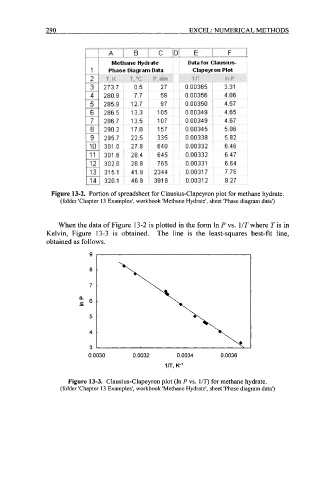
Figure 13-2. Portion of spreadsheet for Clausius-Clapeyron plot for methane hydrate.
(folder 'Chapter 13 Examples', workbook 'Methane Hydrate', sheet 'Phase diagram data')
When the data of Figure 13-2 is plotted in the form In P vs. 1/T where T is in
Kelvin, Figure 13-3 is obtained. The line is the least-squares best-fit line,
obtained as follows.
9,
8
7
n
- E6
5
4
3
0.0030 0.0032 0.0034 0.0036
IlT, K-'
Figure 13-3. Clausius-Clapeyron plot (In P vs. 1/T) for methane hydrate.
(folder 'Chapter 13 Examples', workbook 'Methane Hydrate', sheet 'Phase diagram data')