
Page 312 - Excel for Scientists and Engineers: Numerical Methods
P. 312
CHAPTER 13 LINEAR REGRESSION AND CURVE FITTING 289
Least-Squares Fit to a Straight Line
Using the Worksheet Functions
SLOPE, INTERCEPT and RSQ
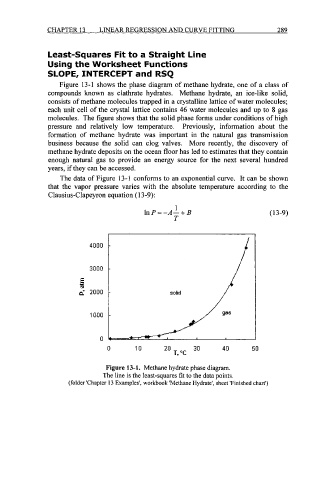
Figure 13-1 shows the phase diagram of methane hydrate, one of a class of
compounds known as clathrate hydrates. Methane hydrate, an ice-like solid,
consists of methane molecules trapped in a crystalline lattice of water molecules;
each unit cell of the crystal lattice contains 46 water molecules and up to 8 gas
molecules. The figure shows that the solid phase forms under conditions of high
pressure and relatively low temperature. Previously, information about the
formation of methane hydrate was important in the natural gas transmission
business because the solid can clog valves. More recently, the discovery of
methane hydrate deposits on the ocean floor has led to estimates that they contain
enough natural gas to provide an energy source for the next several hundred
years, if they can be accessed.
The data of Figure 13-1 conforms to an exponential curve. It can be shown
that the vapor pressure varies with the absolute temperature according to the
Clausius-Clapeyron equation (1 3-9):
1
In P = -A- + B (1 3-9)
T
4000
3000
E
a- 2000
1000
0
0 10 30 40 50
2o T,"C
Figure 13-1. Methane hydrate phase diagram.
The line is the least-squares fit to the data points.
(folder 'Chapter 13 Examples', workbook 'Methane Hydrate', sheet 'Finished chart')