
Page 315 - Excel for Scientists and Engineers: Numerical Methods
P. 315
292 EXCEL: NUMERICAL METHODS
function LINEST. LINEST (for bear estimation) is the most versatile of the
three, so we will begin with it.
The worksheet function LINEST returns the coefficients of multiple linear
regression. As a first illustration, we will use LINEST to obtain the slope and
intercept of the least-squares straight line through the data points of Figure 13-2.
Least-Squares Fit to a Straight Line
Using LINEST
Although you may find LINEST a bit confusing at first (the help description
for most functions occupies a page or less, while the printed help for LINEST is
seven pages), you will soon "get the hang of it" and will find that it is much to be
preferred over the other methods that Excel provides for doing least-squares
curve fitting.
The general form of the linear equation that can be handled by LINEST is
y = mlxl + m2x2 + m3x3 + ... + b (13-1 2)
LINEST returns the array of regression coefficients m,, . . ., m2, ml, b. The
syntax is LINEST(knownjs, known-xs, const_logical, sfafs-logical). If
const_logica/ is TRUE or omitted, the regression coefficients include an intercept
b; if consf-logical is FALSE, the fit does not include the intercept b. If
sfafs-logical is TRUE, LINEST returns an array of regression statistics in addition
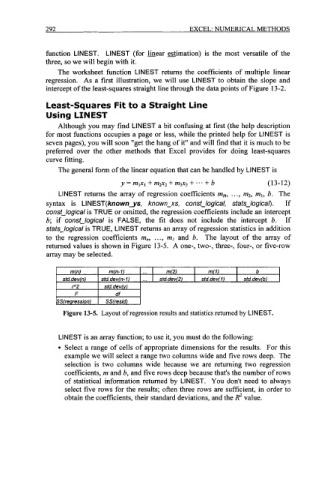
to the regression coefficients m,, . . ., ml and b. The layout of the array of
returned values is shown in Figure 13-5. A one-, two-, three-, four-, or five-row
array may be selected.
m(n) m(n-1) ... m(2) m(1) I b
std.dev(n) std.dev(n-1) ... I std.dev(2) I std.dev( 1 j I std.dev(bl
rA2 std.dev(y)
F df
SS(regressi0n) SS(resid)
LINEST is an array function; to use it, you must do the following:
9 Select a range of cells of appropriate dimensions for the results. For this
example we will select a range two columns wide and five rows deep. The
selection is two columns wide because we are returning two regression
coefficients, rn and b, and five rows deep because that's the number of rows
of statistical information returned by LINEST. You don't need to always
select five rows for the results; often three rows are sufficient, in order to
obtain the coefficients, their standard deviations, and the R2 value.