
Page 314 - Excel for Scientists and Engineers: Numerical Methods
P. 314
CHAPTER 13 LINEAR REGRESSION AND CURVE FITTING 29 1
The SLOPE, INTERCEPT and RSQ worksheet functions were used to obtain
the least-squares best fit coefficients of the data, plus R2, the coefficient of
determination. The syntax of the SLOPE function is SLOPE(known_y's,
known-x's); the arguments of INTERCEPT and RSQ are the same as for the
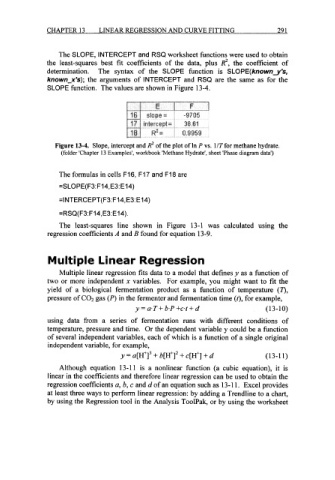
SLOPE function. The values are shown in Figure 13-4.
slope= -9705
intercept= 38.61
0.9959
Figure 13-4. Slope, intercept and R2 of the plot of In P vs. 1/T for methane hydrate.
(folder 'Chapter 13 Examples', workbook 'Methane Hydrate', sheet 'Phase diagram data')
The formulas in cells F16, F17 and F18 are
=SLOPE( F3: F14,E3: E14)
=INTERCEPT(F3:F14,E3:E14)
=RSQ(F3:F14, E3:E14).
The least-squares line shown in Figure 13-1 was calculated using the
regression coefficients A and B found for equation 13-9.
Multiple Linear Regression
Multiple linear regression fits data to a model that defines y as a function of
two or more independent x variables. For example, you might want to fit the
yield of a biological fermentation product as a function of temperature (0,
pressure of C02 gas (P) in the fermenter and fermentation time (t), for example,
y = a.T + b.P +c.t + d ( 13- 1 0)
using data from a series of fermentation runs with different conditions of
temperature, pressure and time. Or the dependent variable y could be a function
of several independent variables, each of which is a function of a single original
independent variable, for example,
y = a[H'I3 + b[H']* + c[P] + d (13-1 1)
Although equation 13-1 1 is a nonlinear function (a cubic equation), it is
linear in the coefficients and therefore linear regression can be used to obtain the
regression coefficients a, b, c and d of an equation such as 13-1 1. Excel provides
at least three ways to perform linear regression: by adding a Trendline to a chart,
by using the Regression tool in the Analysis ToolPak, or by using the worksheet