
Page 327 - Excel for Scientists and Engineers: Numerical Methods
P. 327
304 EXCEL: NUMERICAL METHODS
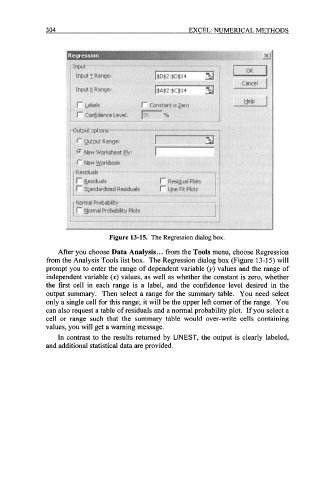
Figure 13-15. The Regression dialog box.
After you choose Data Analysis.. . from the Tools menu, choose Regression
from the Analysis Tools list box. The Regression dialog box (Figure 13-15) will
prompt you to enter the range of dependent variable (y) values and the range of
independent variable (x) values, as well as whether the constant is zero, whether
the first cell in each range is a label, and the confidence level desired in the
output summary. Then select a range for the summary table. You need select
only a single cell for this range; it will be the upper left corner of the range. You
can also request a table of residuals and a normal probability plot. If you select a
cell or range such that the summary table would over-write cells containing
values, you will get a warning message.
In contrast to the results returned by LINEST, the output is clearly labeled,
and additional statistical data are provided.