
Page 324 - Excel for Scientists and Engineers: Numerical Methods
P. 324
CHAPTER 13 LINEAR REGRESSION AND CURVE FITTING 301
40
R' = 0.9999
5c 20
r"
S
0-
2 0
m
C
'i
-20
!
LL -40
0 10 20 30 40 50 60
Wt% Ethylene Glycol
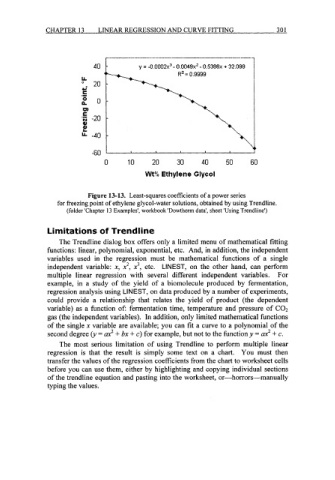
Figure 13-13. Least-squares coefficients of a power series
for freezing point of ethylene glycol-water solutions, obtained by using Trendline.
(folder 'Chapter 13 Examples', workbook 'Dowtherm data', sheet 'Using Trendline')
Limitations of Trendline
The Trendline dialog box offers only a limited menu of mathematical fitting
functions: linear, polynomial, exponential, etc. And, in addition, the independent
variables used in the regression must be mathematical functions of a single
independent variable: x, x2, x3, etc. LINEST, on the other hand, can perform
multiple linear regression with several different independent variables. For
example, in a study of the yield of a biomolecule produced by fermentation,
regression analysis using LINEST, on data produced by a number of experiments,
could provide a relationship that relates the yield of product (the dependent
variable) as a function of: fermentation time, temperature and pressure of C02
gas (the independent variables). In addition, only limited mathematical functions
of the single x variable are available; you can fit a curve to a polynomial of the
second degree o/ = ax2 + bx + c) for example, but not to the function y = ax2 + c.
The most serious limitation of using Trendline to perform multiple linear
regression is that the result is simply some text on a chart. You must then
transfer the values of the regression coefficients from the chart to worksheet cells
before you can use them, either by highlighting and copying individual sections
of the trendline equation and pasting into the worksheet, or-horrors-manually
typing the values.