
Page 326 - Excel for Scientists and Engineers: Numerical Methods
P. 326
CHAPTER 13 LINEAR REGRESSION AND CURVE FITTING 303
power a =EXP(INDEX(LINEST(LN(y-values),LN(x-values), 1,0),2))
b =INDEX(LINEST(LN(y-values),LN(x-values),l,O),l)
I
exponential a =EXP( NDEX( LIN EST( LN(y-values),x-values, 1,0),2))
b =I N D EX( LI N EST( LN ( y-vat ues) , x-values ,I , 0) ,I )
The formulas for polynomials of other orders should be apparent from the
example given.
Even though LINEST is an array function and must be entered using
CTRL+SHIFT+ENTER, you do not need to "array-enter" these formulas.
Note that the formulas for the regression coefficients a and b for linear,
logarithmic and polynomial equations differ only in the value of the last
argument (the row-num argument of INDEX). The formulas for power and
exponential are not identical.
The formula for RSQ for the linear equation is
,I
)
=I N D EX( LI N EST( y-val ues, x-values ,I ,3,1)
and there are similar formulas for the other fitting functions.
Using the Regression Tool in Analysis Tools
Linear regression can also be performed using the Add-In package called the
Analysis ToolPak. If the Analysis ToolPak Add-In is installed, the Data
Analysis ... command will be present at the bottom of the Tools menu; if the
Data Analysis ... command is not present in the Tools menu, choose Add-Ins ...
from the Tools menu and check the box for Analysis ToolPak or Analysis
ToolPak (VBA) to install it. Now when you click on the Tools menu you will
see the Data Analysis.. . command.
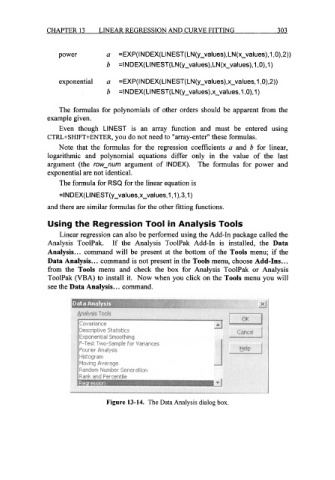
Figure 13-14. The Data Analysis dialog box.