Page 169 - Failure Analysis Case Studies II
P. 169

154


            Y z


            0
            a
            s
            W
            K
            3
            I-
            n
            3
            K


                    0      1      2      3      4      5      6      7      0
                                                CRACK  DEPTH  (mm)


                1500


            z
            A
                1000
            0
            a
            s
            W
            K                                      0
            3                                                           b
            I-
            n    500
            3
            K
                                                            BRITTLE FRACTURE

                  0

                                      DEFECT  DEPTH  (mm)
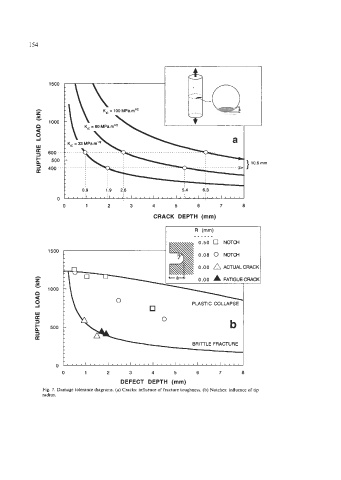
              Fig. 7. Damage tolerance diagrams. (a) Cracks: influence of fracture toughness. (b) Notches: influence of tip
              radius.
   164   165   166   167   168   169   170   171   172   173   174