
Page 167 - Failure Analysis Case Studies II
P. 167
m
152
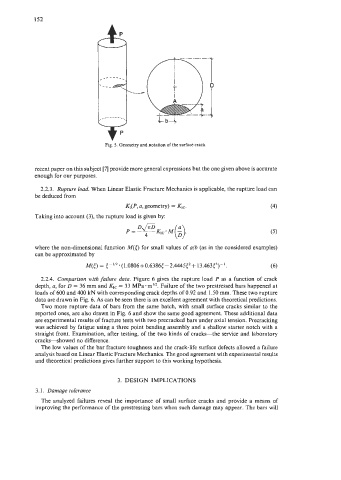
Fig. 5. Geometry and notation of the surface crack.
recent paper on this subject [7] provide more general expressions but the one given above is accurate
enough for our purposes.
2.2.3. Rupture load. When Linear Elastic Fracture Mechanics is applicable, the rupture load can
be deduced from
K,(P, a, geometry) = Kre (4)
Taking into account (3), the rupture load is given by:
where the non-dimensional function M(5) for small values of a/b (as in the considered examples)
can be approximated by
M(c) = t-"' * (1.0806+0.6386< -2.4445c2 + 13.4635))- I. (6)
2.2.4. Comparison with failure dura. Figure 6 gives the rupture load P as a function of crack
depth, a, for D = 36 mm and Krc = 33 MPa.m''*. Failure of the two prestressed bars happened at
loads of 600 and 400 kN with corresponding crack depths of 0.92 and 1 SO mm. These two rupture
data are drawn in Fig. 6. As can be seen there is an excellent agreement with theoretical predictions.
Two more rupture data of bars from the same batch, with small surface cracks similar to the
reported ones, are also drawn in Fig. 6 and show the same good agreement. These additional data
are experimental results of fracture tests with two precracked bars under axial tension. Precracking
was achieved by fatigue using a three point bending assembly and a shallow starter notch with a
straight front. Examination, after testing, of the two kinds of cracks-the service and laboratory
cracks-showed no difference.
The low values of the bar fracture toughness and the crack-life surface defects allowed a failure
analysis based on Linear Elastic Fracture Mechanics. The good agreement with experimental results
and theoretical predictions gives further support to this working hypothesis.
3. DESIGN IMPLICATIONS
3.1 . Damage to Ierance
The analyzed failures reveal the importance of small surface cracks and provide a means of
improving the performance of the prestressing bars when such damage may appear. The bars will