
Page 164 - Failure Analysis Case Studies II
P. 164
149
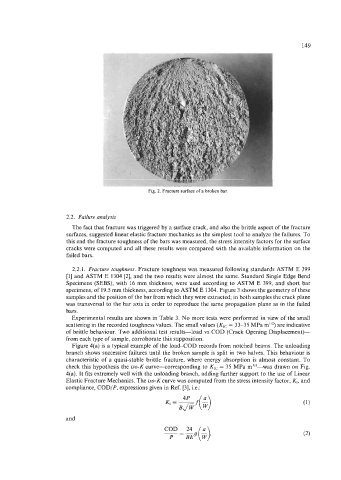
Fig. 2. Fracture surface of a broken bar.
2.2. Failure analysis
The fact that fracture was triggered by a surface crack, and also the brittle aspect of the fracture
surfaces, suggested linear elastic fracture mechanics as the simplest tool to analyze the failures. To
this end the fracture toughness of the bars was measured, the stress intensity factors for the surface
cracks were computed and all these results were compared with the available information on the
failed bars.
2.2.1. Fracture toughness. Fracture toughness was measured following standards ASTM E 399
[I] and ASTM E 1304 [2], and the two results were almost the same. Standard Single Edge Bend
Specimens (SEBS), with 16 mm thickness, were used according to ASTM E 399, and short bar
specimens, of 19.5 mm thickness, according to ASTM E 1304. Figure 3 shows the geometry of these
samples and the position of the bar from which they were extracted; in both samples the crack plane
was transversal to the bar axis in order to reproduce the same propagation plane as in the failed
bars.
Experimental results are shown in Table 3. No more tests were performed in view of the small
scattering in the recorded toughness values. The small values (KIc = 33-35 MPa mil2) are indicative
of brittle behaviour. Two additional test results-load vs COD (Crack Opening Displacement)-
from each type of sample, corroborate this supposition.
Figure 4(a) is a typical example of the load-COD records from notched beams. The unloading
branch shows successive failures until the broken sample is split in two halves. This behaviour is
characteristic of a quasi-stable brittle fracture, where energy absorption is almost constant. To
check this hypothesis the iso-K curve-corresponding to K,, = 35 MPa mi/*-was drawn on Fig.
4(a). It fits extremely well with the unloading branch, adding further support to the use of Linear
Elastic Fracture Mechanics. The iso-K curve was computed from the stress intensity factor, KI, and
compliance, CODIP, expressions given in Ref. [3], Le.:
KI = -f(G)
4P
BJW
and
COD 24