Page 166 - Failure Analysis Case Studies II
P. 166

151
                                  15


                                    0        0.2       0.4       0.6       0.8        1
                                                          COD  (mm)

                                  5 c"


                                     0       0.1       0.2       0.3       0.4       0.5
                                                         COD  (mm)
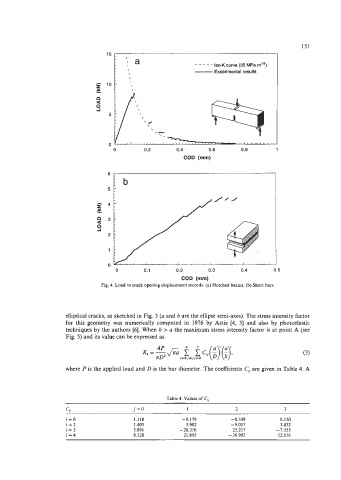
                                Fig. 4. Load vs crack opening displacement records. (a) Notched beams. @)  Short bars.


                     elliptical cracks, as sketched in Fig. 5 (a and b are the ellipse semi-axes). The stress intensity factor
                     for  this geometry was  numerically computed in  1976 by  Astiz  [4,  51  and  also by  photoelastic
                     techniques by the authors [6].  When b > a the maximum stress intensity factor is at point A (see
                     Fig. 5) and its value can be expressed as


                     where P is the applied load and D is the bar diameter. The coefficients C, are given in Table 4. A


                                                    Table 4. Values of C,
                     cu                   j=O              1              2              3
                     i=O                  1.118          -0.179         -0.339          0.130
                     i=2                  1.405            5.902        -9.057          3.032
                     i=3                  3.891         -20.370          23.217       -7.555
                      i=4                 8.328           21.895        - 36.992       12.676
   161   162   163   164   165   166   167   168   169   170   171