
Page 165 - Failure Analysis Case Studies II
P. 165
150
a
b
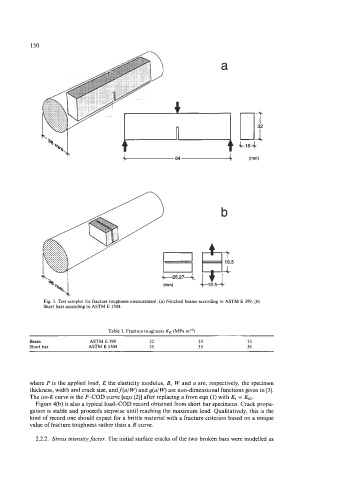
Fig. 3. Test samples for fracture toughness measurement. (a) Notched beams according to ASTM E 399. (b)
Short bars according to ASTM E 1304.
Table 3. Fracture toughness K,, (MPa m”’)
Beam ASTM E 399 32 33 33
Short bar ASTM E 1304 35 35 36
where P is the applied load, E the elasticity modulus, B, Wand a are, respectively, the specimen
thickness, width and crack size, and f (a/W) and g(a/W) are non-dimensional functions given in [3].
The iso-Kcurve is the P-COD curve [eqn (211 after replacing a from eqn (1) with KI = KIc.
Figure 4(b) is also a typical load-COD record obtained from short bar specimens. Crack propa-
gation is stable and proceeds stepwise until reaching the maximum load. Qualitatively, this is the
kind of record one should expect for a brittle material with a fracture criterion based on a unique
value of fracture toughness rather than a &curve.
2.2.2. Stress intensity factor. The initial surface cracks of the two broken bars were modelled as