
Page 168 - Failure Analysis Case Studies II
P. 168
153
1500
z
h
c
1000
500
0 :1 j 2 3 4 5 6 7 8
0.9 1.5 CRACK DEPTH (mm)
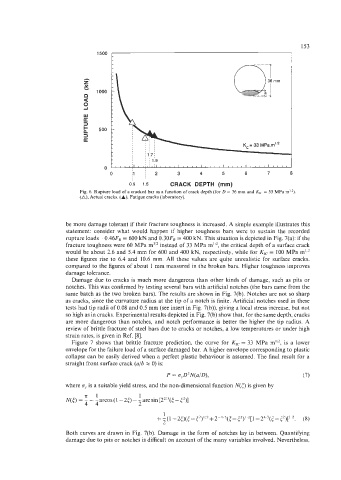
Fig. 6. Rupture load of a cracked bar as a function of crack depth (for D = 36 mm and K,, = 33 MPa rnl/2).
(A), Actual cracks. (A), Fatigue cracks (laboratory).
be more damage tolerant if their fracture toughness is increased. A simple example illustrates this
statement: consider what would happen if higher toughness bars were to sustain the recorded
rupture loads--0.46FR = 600 kN and 0.30FR = 400 kN. This situation is depicted in Fig. 7(a): if the
fracture toughness were 60 MPa mll2 instead of 33 MPa m'12, the critical depth of a surface crack
would be about 2.6 and 5.4 mm for 600 and 400 kN, respectively, while for K,, = 100 MPa m'12
these figures rise to 6.4 and 10.6 mm. All these values are quite unrealistic for surface cracks,
compared to the figures of about 1 mm measured in the broken bars. Higher toughness improves
damage tolerance.
Damage due to cracks is much more dangerous than other kinds of damage, such as pits or
notches. This was confirmed by testing several bars with artificial notches (the bars came from the
same batch as the two broken bars). The results are shown in Fig. 7(b). Notches are not so sharp
as cracks, since the curvature radius at the tip of a notch is finite. Artificial notches used in these
tests had tip radii of 0.08 and 0.5 mm (see insert in Fig. 7(b)), giving a local stress increase, but not
so high as in cracks. Experimental results depicted in Fig. 7(b) show that, for the same depth, cracks
are more dangerous than notches, and notch performance is better the higher the tip radius. A
review of brittle fracture of steel bars due to cracks or notches, a low temperatures or under high
strain rates, is given in Ref. [8].
Figure 7 shows that brittle fracture prediction, the curve for K,, = 33 MPa rn1l2, is a lower
envelope for the failure load of a surface damaged bar. A higher envelope corresponding to plastic
collapse can be easily derived when a perfect plastic behaviour is assumed. The final result for a
straight front surface crack (a/b z 0) is:
P = G,D~N(u/D), (7)
where G, is a suitable yield stress, and the non-dimensional function N(f) is given by
n
1
1
N(5) = - - - arcos (1 - 25) - -arc sin [22'3(5 - t2)]
4 4 2
1
+ 2(1 -25)(5 - t2)Il2 +2- 'I3(<-- <')'/'[l -24'3(5 - 52)]1'2. (8)
Both curves are drawn in Fig. 7(b). Damage in the form of notches lay in between. Quantifying
damage due to pits or notches is difficult on account of the many variables involved. Nevertheless,