Page 18 - Failure Analysis Case Studies II
P. 18

5


                                                                                   2.4
                                                                                   2.4
                                                                                    2.4
                                                                                   2.4
                                                                                   2.4
                                                                                   2.4
                                                                                   2.4
                                    E
                                    s                                              3.4
                                    cu
                                    N
                                                                                   3.4
                                                                                   3.4
                                                                                   4.2
                                                                                   4.2
                                    i rn Dia.                                      5.0
                                    ___(
                                                                                   5.7
                                                                                   5.7
                                                                                   5.7
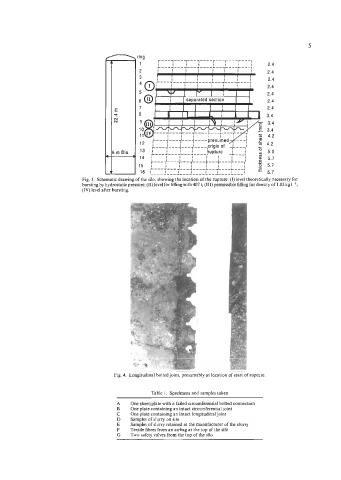
                          Fig. 3.  Schematic drawing of the silo, showing the location of the rupture: (I) level theoretically necessary for
                          bursting by hydrostatic pressure; (11) level for filling with 407 t; (111) permissible filling for density of 1.05 kg I-';
                          (IV) level after bursting.


                                                                        !
                                                                        I


                                    Fig. 4.  Longitudinal bolted joint, presumably at location of start of rupture

                                               Table 1.  Specimens and samples taken
                                     A   One sheet/plate with a failed circumferential bolted connection
                                     B   One plate containing an intact circumferential joint
                                     C   One plate containing an intact longitudinal joint
                                     D   Samples of slurry on site
                                     E   Samples of slurry retained at the manufacturer of the slurry
                                     F   Textile fibres from an airbag at the top of the silo
                                     G   Two safety valves from the top of the silo
                                     -
   13   14   15   16   17   18   19   20   21   22   23