
Page 20 - Failure Analysis Case Studies II
P. 20
7
30 -
20-
f fi.2
I I I I I
5 10 15 20 25 AI [mml
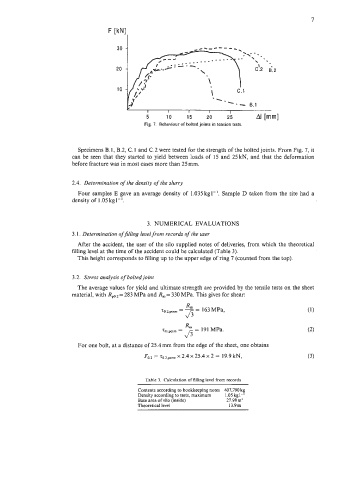
Fig. 7. Behaviour of bolted joints in tension tests.
Specimens B. 1, B.2, C. 1 and C.2 were tested for the strength of the bolted joints. From Fig. 7, it
can be seen that they started to yield between loads of 15 and 25 kN, and that the deformation
before fracture was in most cases more than 25 mm.
2.4. Determination of the density of the slurry
Four samples E gave an average density of 1.035 kgl-'. Sample D taken from the site had a
density of 1.05 kgl-I.
3. NUMERICAL EVALUATIONS
3.1. Determination of$lling level from records of the user
After the accident, the user of the silo supplied notes of deliveries, from which the theoretical
filling level at the time of the accident could be calculated (Table 3).
This height corresponds to filling up to the upper edge of ring 7 (counted from the top).
3.2. Stress analysis of boltedjoint
The average values for yield and ultimate strength are provided by the tensile tests on the sheet
material, with Rpo.2 = 283 MPa and R, = 330 MPa. This gives for shear:
z0.2,pem = 3 163 MPa,
=
Rm 191MPa.
zm*- = fi =
For one bolt, at a distance of 25.4mm from the edge of the sheet, one obtains
Fo.2 = ~~.2,~,,,, x 2.4 x 25.4 x 2 = 19.9 kN, (3)
Table 3. Calculation of filling level from records
Contents according to bookkeeping notes 407,790 kg
Density according to tests, maximum 1.05 kgl-'
Base area of silo (inside) 27.98m2
Theoretical level 13.9m