
Page 190 - Failure Analysis Case Studies II
P. 190
175
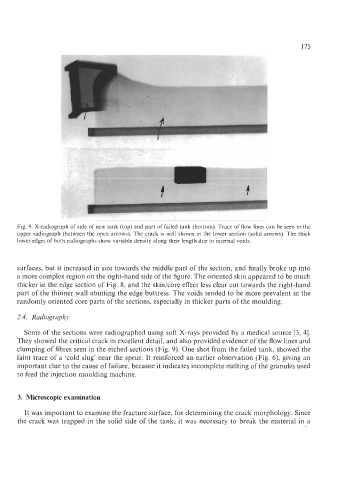
Fig. 9. X-radiograph of side of new tank (top) and part of failed tank (bottom). Trace of flow lines can be seen in the
upper radiograph (between the open arrows). The crack is well shown in the lower section (solid arrows). The thick
lower edges of both radiographs show variable density along their length due to internal voids.
surfaces, but it increased in size towards the middle part of the section, and finally broke up into
a more complex region on the right-hand side of the figure. The oriented skin appeared to be much
thicker in the edge section of Fig. 8, and the skin/core effect less clear cut towards the right-hand
part of the thinner wall abutting the edge buttress. The voids tended to be more prevalent in the
randomly oriented core parts of the sections, especially in thicker parts of the moulding.
2.4. Radiography
Some of the sections were radiographed using soft X-rays provided by a medical source [3, 41.
They showed the critical crack in excellent detail, and also provided evidence of the flow lines and
clumping of fibres seen in the etched sections (Fig. 9). One shot from the failed tank, showed the
faint trace of a ‘cold slug’ near the sprue. It reinforced an earlier observation (Fig. 6), giving an
important clue to the cause of failure, because it indicates incomplete melting of the granules used
to feed the injection moulding machine.
3. Microscopic examination
It was important to examine the fracture surface, for determining the crack morphology. Since
the crack was trapped in the solid side of the tank, it was necessary to break the material in a