
Page 272 - Failure Analysis Case Studies II
P. 272
257
Sled
Steel Shafts
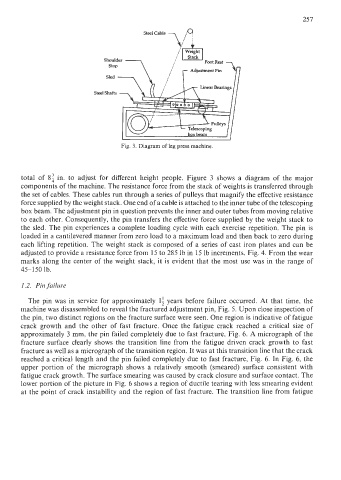
Fig. 3. Diagram of leg press machine.
total of 8: in. to adjust for different height people. Figure 3 shows a diagram of the major
components of the machine. The resistance force from the stack of weights is transferred through
the set of cables. These cables run through a series of pulleys that magnify the effective resistance
force supplied by the weight stack. One end of a cable is attached to the inner tube of the telescoping
box beam. The adjustment pin in question prevents the inner and outer tubes from moving relative
to each other. Consequently, the pin transfers the effective force supplied by the weight stack to
the sled. The pin experiences a complete loading cycle with each exercise repetition. The pin is
loaded in a cantilevered manner from zero load to a maximum load and then back to zero during
each lifting repetition. The weight stack is composed of a series of cast iron plates and can be
adjusted to provide a resistance force from 15 to 285 lb in 15 lb increments, Fig. 4. From the wear
marks along the center of the weight stack, it is evident that the most use was in the range of
45-1 50 lb.
I .2. Pin,failure
The pin was in service for approximately 1: years before failure occurred. At that time, the
machine was disassembled to reveal the fractured adjustment pin, Fig. 5. Upon close inspection of
the pin, two distinct regions on the fracture surface were seen. One region is indicative of fatigue
crack growth and the other of fast fracture. Once the fatigue crack reached a critical size of
approximately 3 mm, the pin failed completely due to fast fracture, Fig. 6. A micrograph of the
fracture surface clearly shows the transition line from the fatigue driven crack growth to fast
fracture as well as a micrograph of the transition region. It was at this transition line that the crack
reached a critical length and the pin failed completely due to fast fracture, Fig. 6. In Fig. 6, the
upper portion of the micrograph shows a relatively smooth (smeared) surface consistent with
fatigue crack growth. The surface smearing was caused by crack closure and surface contact. The
lower portion of the picture in Fig. 6 shows a region of ductile tearing with less smearing evident
at the point of crack instability and the region of fast fracture. The transition line from fatigue