
Page 273 - Failure Analysis Case Studies II
P. 273
258
Fig. 4. Picture of weight stack.
Load
0
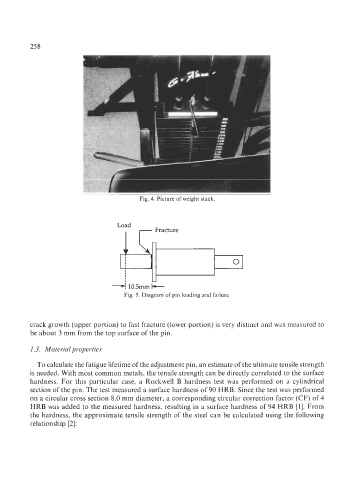
Fig. 5. Diagram of pin loading and failure.
crack growth (upper portion) to fast fracture (lower portion) is very distinct and was measured to
be about 3 mm from the top surface of the pin.
I .3. Material properties
To calculate the fatigue lifetime of the adjustment pin, an estimate of the ultimate tensile strength
is needed. With most common metals, the tensile strength can be directly correlated to the surface
hardness. For this particular case, a Rockwell B hardness test was performed on a cylindrical
section of the pin. The test measured a surface hardness of 90 HRB. Since the test was performed
on a circular cross section 8.0 mm diameter, a corresponding circular correction factor (CF) of 4
HRB was added to the measured hardness, resulting in a surface hardness of 94 HRB [ 13. From
the hardness, the approximate tensile strength of the steel can be calculated using the following
relationship [2]: