
Page 274 - Failure Analysis Case Studies II
P. 274
259
,' :;a
,."
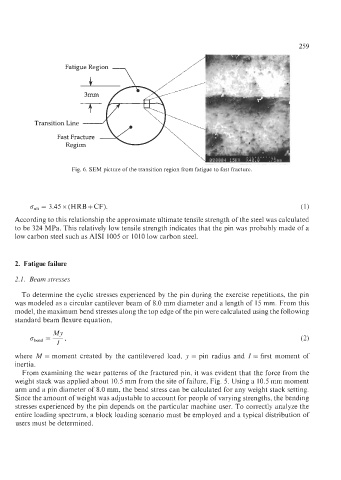
Fatigue Region ,... ./'
Fig. 6. SEM picture of the transition region from fatigue to fast fracture.
cult = 3.45 x (HRB + CF). (1)
According to this relationship the approximate ultimate tensile strength of the steel was calculated
to be 324 MPa. This relatively low tensile strength indicates that the pin was probably made of a
low carbon steel such as AIS1 1005 or 1010 low carbon steel.
2. Fatigue failure
2.1. Beam stresses
To determine the cyclic stresses experienced by the pin during the exercise repetitions, the pin
was modeled as a circular cantilever beam of 8.0 mm diameter and a length of 15 mm. From this
model, the maximum bend stresses along the top edge of the pin were calculated using the following
standard beam flexure equation,
where M = moment created by the cantilevered load, y = pin radius and I = first moment of
inertia.
From examining the wear patterns of the fractured pin, it was evident that the force from the
weight stack was applied about 10.5 mm from the site of failure, Fig. 5. Using a 10.5 mm moment
arm and a pin diameter of 8.0 mm, the bend stress can be calculated for any weight stack setting.
Since the amount of weight was adjustable to account for people of varying strengths, the bending
stresses experienced by the pin depends on the particular machine user. To correctly analyze the
entire loading spectrum, a block loading scenario must be employed and a typical distribution of
users must be determined.