Page 364 - Failure Analysis Case Studies II
P. 364
349
                        The prediction is of limited validity for KI less than  18 MPa Jm,  since no failures had occurred
                       to specimens loaded to this level after 4 years.
                        Lewandowski et al. [2] give experimental data for alloy 6351 at tested at three temperatures in
                       specially prepared ingots doped with controlled Pb additions. Some of the data from Lewandowski
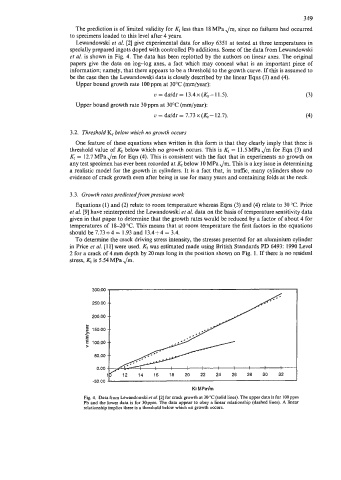
                       et al. is shown in Fig. 4.  The data has been replotted by the authors on linear axes. The original
                       papers give the data on log-log  axes, a fact which  may conceal what is an important piece  of
                       information; namely, that there appears to be a threshold to the growth curve. If this is assumed to
                       be the case then the Lewandowski data is closely described by the linear Eqns (3) and (4).
                        Upper bound growth rate lOOppm at 30°C (mm/year):
                                                 v  = da/dt = 13.4x(KI-11.5).                  (3)
                        Upper bound growth rate 3Oppm at 30°C (mm/year):
                                                 u = da/dt = 7.73 x (Kl- 12.7).                (4)

                       3.2.  Threshold K, below which no growth occurs
                        One feature of these equations when written in this form is that they clearly imply that there is
                       threshold value of K, below which no growth occurs. This is KI = 11.5 MPa Jm  for Eqn (3) and
                       K, = 12.7 MPa Jm  for Eqn (4). This is consistent with the fact that in experiments no growth on
                       any test specimen has ever been recorded at KI below 10 MPa Jm.  This is a key issue in determining
                       a realistic model for the growth in cylinders. It is a fact that, in traffic,  many cylinders show no
                       evidence of crack growth even after being in use for many years and containing folds at the neck.

                       3.3.  Growth rates predicted from previous work
                        Equations (1) and (2) relate to room temperature whereas Eqns (3) and (4) relate to 30 "C. Price
                       et al. [9] have reinterpreted the Lewandowski et al. data on the basis of temperature sensitivity data
                       given in that paper to determine that the growth rates would be reduced by a factor of about 4 for
                       temperatures of  18-20  "C. This means that at room temperature the first factors in the equations
                       should be 1.73+4 = 1.93 and 13.4+4  = 3.4.
                        To determine the crack driving stress intensity, the stresses presented for an aluminium cylinder
                      in Price et al. [ll] were used. Kr was estimated made using British Standards PD 6493: 1990 Level
                       2 for a crack of 4 mm depth by 20 mm long in the position shown on Fig. 1. If there is no residual
                       stress, KI is 5.54 MPa Jm.


                             300.00  ~   ~~
                              250.00 --

                             200.00 --
                            L
                            1 150.00--
                           2
                            E


                              -50.00 -
                                                            KI MPdm
                           Fig. 4.  Data from Lewandowski er d. [2] for crack growth at 30 "C (solid lines). The upper data is for lOOppm
                           Pb and the lower data is for 30ppm. The data appear to obey a linear relationship (dashed lines). A linear
                           relationship implies there is a threshold below which no growth oocurs.

