
Page 369 - Failure Analysis Case Studies II
P. 369
3 54
5
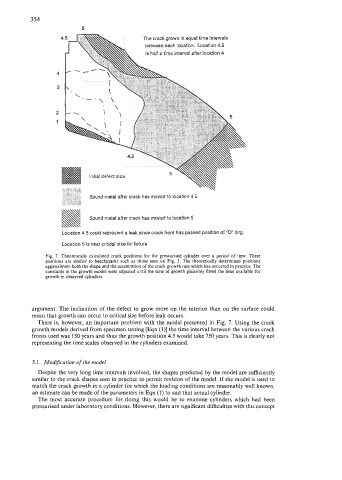
The crack grows in equal time intervals
between each location. Location 4.5
is half a time interval after location 4
Initial defect size
Sound metal after crack has moved to location 4 5
8 Sound metal after crack has moved to location 5
Location 4.5 could represent a leak since crack front has passed position of "0 ring.
Location 5 is near critical size for failure
Fig. 7. Theoretically calculated crack positions for the pressurised cylinder over a period of time. These
positions are similar to beachmarks such as those Seen on Fig. 3. The theoretically determined positions
approximate both the shape and the acceleration of the crack growth rate which has occurred in practice. The
constants in the growth model were adjusted until the time of growth plausibly fitted the time available for
growth in observed cylinders.
argument. The inclination of the defect to grow more on the interior than on the surface could
mean that growth can occur to critical size before leak occurs.
There is, however, an important problem with the model presented in Fig. 7. Using the crack
growth models derived from specimen testing [Eqn (l)] the time interval between the various crack
fronts used was 150 years and thus the growth position 4.5 would take 750 years. This is clearly not
representing the time scales observed in the cylinders examined.
5.1. Modzjication -of the model
Despite the very long time intervals involved, the shapes predicted by the model are sufficiently
similar to the crack shapes seen in practice to permit revision of the model. If the model is used to
match the crack growth in a cylinder for which the loading conditions are reasonably well known,
an estimate can be made of the parameters in Eqn (1) to suit that actual cylinder.
The most accurate procedure for doing this would be to examine cylinders which had been
pressurised under laboratory conditions. However, there are significant difficulties with this concept