
Page 366 - Failure Analysis Case Studies II
P. 366
351
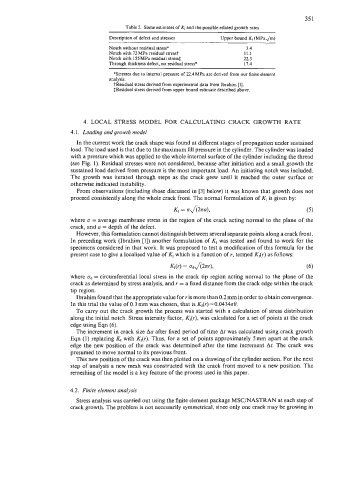
Table 2. Some estimates of K, and the Dossibk related growth rates
Description of defect and stresses Upper bound K, (MPa ,/m)
Notch without residual stress* 3.4
Notch with 72MPa residual stresst 11.1
Notch with 155 MPa residual stress# 22.3
Through thickness defect, no residual stress* 17.4
*Stresses due to internal pressure of 22.4 MPa are derived from our finite element
analysis.
tResidual stress derived from experimental data from Ibrahim [I].
?Residual stress derived from upper bound estimate described above.
4. LOCAL STRESS MODEL FOR CALCULATING CRACK GROWTH RATE
4.1. Loading andgruwth model
In the current work the crack shape was found at different stages of propagation under sustained
load. The load used is that due to the maximum fill pressure in the cylinder. The cylinder was loaded
with a pressure which was applied to the whole internal surface of the cylinder including the thread
(see Fig. 1). Residual stresses were not considered, because after initiation and a small growth the
sustained load derived from pressure is the most important load. An initiating notch was included.
The growth was iterated through steps as the crack grew until it reached the outer surface or
otherwise indicated instability.
From observations (including those discussed in [3] below) it was known that growth does not
proceed consistently along the whole crack front. The normal formulation of Kl is given by:
Kl = u&2na),
where u = average membrane stress in the region of the crack acting normal to the plane of the
crack, and a = depth of the defect.
However, this formulation cannot distinguish between several separate points along a crack front.
In preceding work (Ibrahim [l]) another formulation of KI was tested and found to work for the
specimens considered in that work. It was proposed to test a modification of this formula for the
present case to give a localised value of Kl which is a function of r, termed Kl(r) as follows:
Kdr) = OO&W, (6)
where 0, = circumferential local stress in the crack tip region acting normal to the plane of the
crack as determined by stress analysis, and r = a fixed distance from the crack edge within the crack
tip region.
Ibrahim found that the appropriate value for r is more than 0.2 mm in order to obtain convergence.
In this trial the value of 0.3mm was chosen, that is Kl(r)=0.0434a8.
To carry out the crack growth the process was started with a calculation of stress distribution
along the initial notch. Stress intensity factor, K,(r), was calculated for a set of points at the crack
edge using Eqn (6).
The increment in crack size Aa after fixed period of time At was calculated using crack growth
Eqn (1) replacing K, with Kl(r). Thus, for a set of points approximately 5mm apart at the crack
edge the new position of the crack was determined after the time increment At. The crack was
presumed to move normal to its previous front.
This new position of the crack was then plotted on a drawing of the cylinder section. For the next
step of analysis a new mesh was constructed with the crack front moved to a new position. The
remeshing of the model is a key feature of the process used in this paper.
4.2. Finite element analysis
Stress analysis was carried out using the finite element package MSC/NASTRAN at each step of
crack growth. The problem is not necessarily symmetrical, sincc only one crack may be growing in