Page 115 - Fair, Geyer, and Okun's Water and wastewater engineering : water supply and wastewater removal
P. 115

JWCL344_ch03_061-117.qxd  8/17/10  7:48 PM  Page 78


                    78  Chapter 3  Water Sources: Groundwater


                                                    0

                                                    2
                                                   Drawdown s, ft  4                    s


                                                    6


                                                    8
                                                    0.2           1                  10                100
                                                                           Time t, min
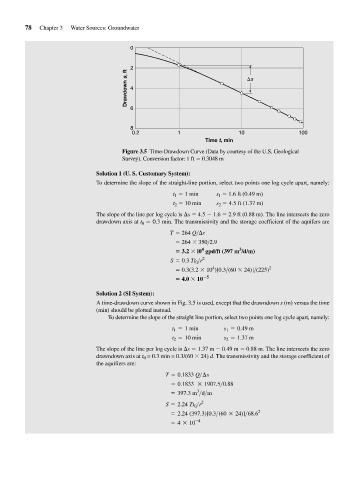
                                                 Figure 3.5 Time-Drawdown Curve (Data by courtesy of the U.S. Geological
                                                 Survey). Conversion factor: 1 ft   0.3048 m

                                         Solution 1 (U. S. Customary System):
                                         To determine the slope of the straight-line portion, select two points one log cycle apart, namely:
                                                                 t 1   1 min  s 1    1.6 ft (0.49 m)
                                                                 t 2   10 min  s 2   4.5 ft (1.37 m)
                                          The slope of the line per log cycle is  s   4.5   1.6   2.9 ft (0.88 m). The line intersects the zero
                                         drawdown axis at t 0   0.3 min. The transmissivity and the storage coefficient of the aquifers are
                                                                T   264 Q> s
                                                                    264   350>2.9
                                                                         4
                                                                                     3
                                                                    3.2   l0 gpd/ft (397 m /d/m)
                                                                S   0.3 Tt 0 >r 2
                                                                             4
                                                                   0.3(3.2   10 )[0.3>(60   24)]>(225) 2
                                                                   4.0   10  5
                                         Solution 2 (SI System):
                                         A time-drawdown curve shown in Fig. 3.5 is used, except that the drawndown s (m) versus the time
                                         (min) should be plotted instead.
                                             To determine the slope of the straight line portion, select two points one log cycle apart, namely:

                                                                   t 1 = 1 min      s 1 = 0.49 m
                                                                   t 2 = 10 min      s 2 = 1.37 m
                                         The slope of the line per log cycle is  s   1.37 m   0.49 m   0.88 m. The line intersects the zero
                                          drawndown axis at t 0 = 0.3 min = 0.3/(60   24) d. The transmissivity and the storage coefficient of
                                         the aquifiers are:
                                                                T = 0.1833 Q>¢s
                                                                 = 0.1833  * 1907.5>0.88
                                                                        3
                                                                 = 397.3 m >d>m
                                                                 S = 2.24 Tt 0 >r 2
                                                                 = 2.24 (397.3)[0.3>(60 * 24)]>68.6 2
                                                                 = 4 * 10 -4
   110   111   112   113   114   115   116   117   118   119   120