
Page 116 - Fair, Geyer, and Okun's Water and wastewater engineering : water supply and wastewater removal
P. 116
JWCL344_ch03_061-117.qxd 8/17/10 7:48 PM Page 79
3.10 Nonsteady Radial Flow 79
Equation 3.18 can also be used if the drawdown is measured at several observation
wells at essentially the same time, that is, from the shape of the cone of depression.
Drawdowns are plotted on the arithmetic scale and distance on the log scale and the result-
ing straight-line graph is called the distance-drawdown curve. It can be shown that the
expressions for T and S in this case are
T 528Q> s (3.23)
S 0.3Tt>r 2 0 (3.24)
With the formation constants T and S known, Eq. 3.18 gives the drawdown for any de-
sired value of r and t, provided that u (Eq. 3.13) is less than 0.01. The value of u is directly
proportional to the square of the distance and inversely proportional to time t. The combi-
nation of time and distance at which u passes the critical value is inversely proportional to
the hydraulic diffusivity of the aquifer, D T>S. The critical value of u is reached much
more quickly in confined aquifers than in unconfined aquifers.
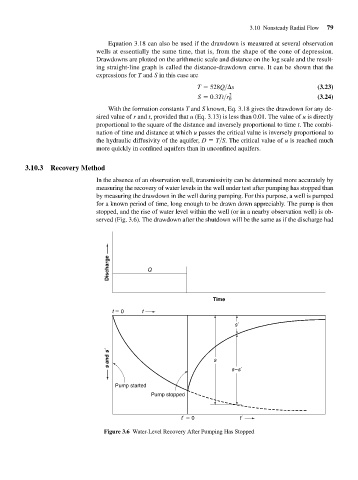
3.10.3 Recovery Method
In the absence of an observation well, transmissivity can be determined more accurately by
measuring the recovery of water levels in the well under test after pumping has stopped than
by measuring the drawdown in the well during pumping. For this purpose, a well is pumped
for a known period of time, long enough to be drawn down appreciably. The pump is then
stopped, and the rise of water level within the well (or in a nearby observation well) is ob-
served (Fig. 3.6). The drawdown after the shutdown will be the same as if the discharge had
Discharge Q
Time
t 0 t
s´
s and s´ s
s–s´
Pump started
Pump stopped
t´ 0 t´
Figure 3.6 Water-Level Recovery After Pumping Has Stopped