
Page 288 - Fair, Geyer, and Okun's Water and wastewater engineering : water supply and wastewater removal
P. 288
JWCL344_ch07_230-264.qxd 8/2/10 8:44 PM Page 248
248 Chapter 7 Water Distribution Systems: Modeling and Computer Applications
Age Analysis
• The analysis of the age of water within the network may be performed by defining and
running an age analysis scenario. From the Analysis menu, select Scenarios.
• Create a new Base Scenario by clicking the New button. Enter “Age Analysis” as the
name of the scenario.
• Click on the Calculation Options tab at the bottom of the window. Create a new
Calculation Option by clicking the New button and enter “Age Analysis Calculation
Options” as the name. Double-click the calculation options you just created and select Age
in the Calculation Type field. The Duration is 168 hours (7 days), and the Hydraulic
Time Step is 1.00 h.
• Go back to the Scenarios tab, right-click the Age Analysis scenario, and select Make
Current. The red check should now be on the Age Analysis scenario. Double-click on the
Age Analysis scenario and select the Age Analysis Calculation Options in the Calculation
Options field.
• Go back to the Scenarios tab and click the Compute button.
• Close the Calculation Summary window and Scenarios dialog to view the layout screen.
Results
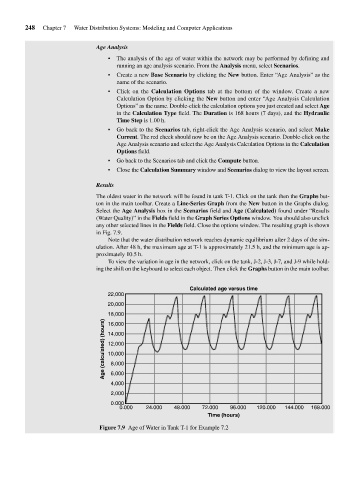
The oldest water in the network will be found in tank T-1. Click on the tank then the Graphs but-
ton in the main toolbar. Create a Line-Series Graph from the New button in the Graphs dialog.
Select the Age Analysis box in the Scenarios field and Age (Calculated) found under “Results
(Water Quality)” in the Fields field in the Graph Series Options window. You should also unclick
any other selected lines in the Fields field. Close the options window. The resulting graph is shown
in Fig. 7.9.
Note that the water distribution network reaches dynamic equilibrium after 2 days of the sim-
ulation. After 48 h, the maximum age at T-1 is approximately 21.5 h, and the minimum age is ap-
proximately 10.5 h.
To view the variation in age in the network, click on the tank, J-2, J-3, J-7, and J-9 while hold-
ing the shift on the keyboard to select each object. Then click the Graphs button in the main toolbar.
Calculated age versus time
22,000
20,000
18,000
Age (calculated) (hours) 14,000
16,000
12,000
10,000
8,000
6,000
4,000
2,000
0.000
0.000 24.000 48.000 72.000 96.000 120.000 144.000 168.000
Time (hours)
Figure 7.9 Age of Water in Tank T-1 for Example 7.2