Page 286 - Fair, Geyer, and Okun's Water and wastewater engineering : water supply and wastewater removal
P. 286

JWCL344_ch07_230-264.qxd  8/2/10  8:44 PM  Page 246


                    246  Chapter 7  Water Distribution Systems: Modeling and Computer Applications

                                                 R-1        PMP-1
                                                      P-12
                                                               P-13
                                                 J-6      P-8      J-7       P-10          J-8  P-11
                                                                                                        J-9

                                                                   P-7                      P-9
                                                 P-1
                                                                              P-6
                                                               J-4                           J-5

                                                 J-1               P-3                      P-5

                                                         P-2
                                                               J-2                           J-3
                                                                              P-4
                                                                   P-14


                                                                    T-1

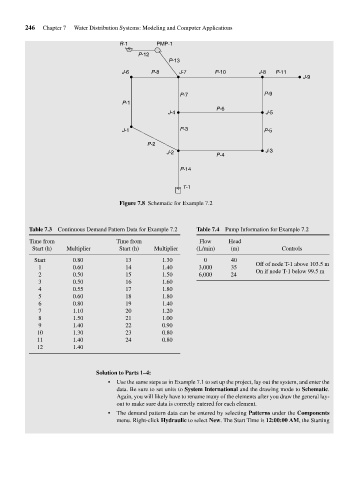
                                                 Figure 7.8 Schematic for Example 7.2


                     Table 7.3  Continuous Demand Pattern Data for Example 7.2  Table 7.4  Pump Information for Example 7.2
                     Time from                  Time from                Flow     Head
                      Start (h)  Multiplier      Start (h)  Multiplier  (L/min)   (m)             Controls
                       Start      0.80            13          1.30        0       40
                                                                                          Off of node T-1 above 103.5 m
                        1         0.60            14          1.40       3,000    35
                                                                                          On if node T-1 below 99.5 m
                        2         0.50            15          1.50       6,000    24
                        3         0.50            16          1.60
                        4         0.55            17          1.80
                        5         0.60            18          1.80
                        6         0.80            19          1.40
                        7         1.10            20          1.20
                        8         1.50            21          1.00
                        9         1.40            22          0.90
                        10        1.30            23          0.80
                        11        1.40            24          0.80
                        12        1.40


                                         Solution to Parts 1–4:
                                             •  Use the same steps as in Example 7.1 to set up the project, lay out the system, and enter the
                                                data. Be sure to set units to System International and the drawing mode to Schematic.
                                                Again, you will likely have to rename many of the elements after you draw the general lay-
                                                out to make sure data is correctly entered for each element.
                                             •  The demand pattern data can be entered by selecting Patterns under the Components
                                                menu. Right-click Hydraulic to select New. The Start Time is 12:00:00 AM, the Starting
   281   282   283   284   285   286   287   288   289   290   291