
Page 290 - Fair, Geyer, and Okun's Water and wastewater engineering : water supply and wastewater removal
P. 290
JWCL344_ch07_230-264.qxd 8/2/10 8:44 PM Page 250
250 Chapter 7 Water Distribution Systems: Modeling and Computer Applications
R-1 PMP-1
P-12
J-6 P-8 P-13 J-7 P-10 J-8 P-11 J-9
P-7 P-9
P-1 J-4 P-6 J-5
J-1
P-3 P-5
P-2
J-2
P-4 J-3
P-14
T-1
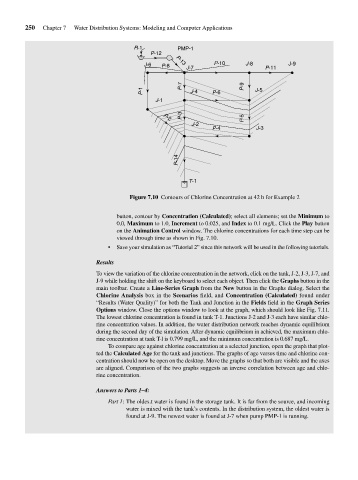
Figure 7.10 Contours of Chlorine Concentration at 42 h for Example 2
button, contour by Concentration (Calculated); select all elements; set the Minimum to
0.0, Maximum to 1.0, Increment to 0.025, and Index to 0.1 mg/L. Click the Play button
on the Animation Control window. The chlorine concentrations for each time step can be
viewed through time as shown in Fig. 7.10.
• Save your simulation as “Tutorial 2” since this network will be used in the following tutorials.
Results
To view the variation of the chlorine concentration in the network, click on the tank, J-2, J-3, J-7, and
J-9 while holding the shift on the keyboard to select each object. Then click the Graphs button in the
main toolbar. Create a Line-Series Graph from the New button in the Graphs dialog. Select the
Chlorine Analysis box in the Scenarios field, and Concentration (Calculated) found under
“Results (Water Quality)” for both the Tank and Junction in the Fields field in the Graph Series
Options window. Close the options window to look at the graph, which should look like Fig. 7.11.
The lowest chlorine concentration is found in tank T-1. Junctions J-2 and J-3 each have similar chlo-
rine concentration values. In addition, the water distribution network reaches dynamic equilibrium
during the second day of the simulation. After dynamic equilibrium in achieved, the maximum chlo-
rine concentration at tank T-l is 0.799 mg/L, and the minimum concentration is 0.687 mg/L.
To compare age against chlorine concentration at a selected junction, open the graph that plot-
ted the Calculated Age for the tank and junctions. The graphs of age versus time and chlorine con-
centration should now be open on the desktop. Move the graphs so that both are visible and the axes
are aligned. Comparison of the two graphs suggests an inverse correlation between age and chlo-
rine concentration.
Answers to Parts 1–4:
Part 1: The oldes.t water is found in the storage tank. It is far from the source, and incoming
water is mixed with the tank’s contents. In the distribution system, the oldest water is
found at J-9. The newest water is found at J-7 when pump PMP-1 is running.