Page 303 - Fair, Geyer, and Okun's Water and wastewater engineering : water supply and wastewater removal
P. 303

JWCL344_ch07_230-264.qxd  8/2/10  8:44 PM  Page 263


                                                                                              Problems/Questions  263
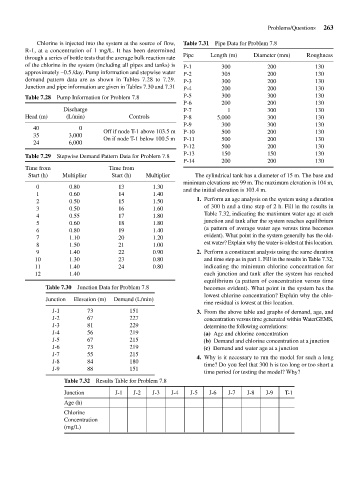
                       Chlorine is injected into the system at the source of flow,  Table 7.31  Pipe Data for Problem 7.8
                    R-1, at a concentration of 1 mg/L. It has been determined
                    through a series of bottle tests that the average bulk reaction rate  Pipe  Length (m)  Diameter (mm)  Roughness
                    of the chlorine in the system (including all pipes and tanks) is  P-1  300  200         130
                    approximately –0.5 /day. Pump information and stepwise water  P-2  305   200            130
                    demand pattern data are as shown in Tables 7.28 to 7.29.  P-3  300       200            130
                    Junction and pipe information are given in Tables 7.30 and 7.31  P-4  200  200          130
                    Table 7.28  Pump Information for Problem 7.8    P-5         300          300            130
                                                                    P-6         200          200            130
                                Discharge                           P-7          1           300            130
                    Head (m)    (L/min)            Controls         P-8       5,000          300            130
                                                                    P-9         300          300            130
                      40            0
                                            Off if node T-1 above 103.5 m  P-10  500         200            130
                      35         3,000
                                            On if node T-1 below 100.5 m  P-11  500          200            130
                      24         6,000
                                                                    P-12        500          200            130
                    Table 7.29  Stepwise Demand Pattern Data for Problem 7.8  P-13  150      150            130
                                                                    P-14        200          200            130
                    Time from                Time from
                     Start (h)  Multiplier    Start (h)  Multiplier     The cylindrical tank has a diameter of 15 m. The base and
                                                                    minimum elevations are 99 m. The maximum elevation is 104 m,
                       0         0.80           13         1.30
                                                                    and the initial elevation is 103.4 m.
                       1         0.60           14         1.40
                       2         0.50           15         1.50         1. Perform an age analysis on the system using a duration
                       3         0.50           16         1.60           of 300 h and a time step of 2 h. Fill in the results in
                       4         0.55           17         1.80           Table 7.32, indicating the maximum water age at each
                       5         0.60           18         1.80           junction and tank after the system reaches equilibrium
                       6         0.80           19         1.40           (a pattern of average water age versus time becomes
                       7         1.10           20         1.20           evident). What point in the system generally has the old-
                       8         1.50           21         1.00           est water? Explain why the water is oldest at this location.
                       9         1.40           22         0.90         2. Perform a constituent analysis using the same duration
                       10        1.30           23         0.80           and time step as in part 1. Fill in the results in Table 7.32,
                       11        1.40           24         0.80           indicating the minimum chlorine concentration for
                       12        1.40                                     each junction and tank after the system has reached
                                                                          equilibrium (a pattern of concentration versus time
                          Table 7.30  Junction Data for Problem 7.8       becomes evident). What point in the system has the
                                                                          lowest chlorine concentration? Explain why the chlo-
                          Junction  Elevation (m)  Demand (L/min)
                                                                          rine residual is lowest at this location.
                            J-1        73           151                 3. From the above table and graphs of demand, age, and
                            J-2        67           227                   concentration versus time generated within WaterGEMS,
                            J-3        81           229                   determine the following correlations:
                            J-4        56           219                   (a) Age and chlorine concentration
                            J-5        67           215                   (b) Demand and chlorine concentration at a junction
                            J-6        73           219                   (c) Demand and water age at a junction
                            J-7        55           215
                                                                        4. Why is it necessary to run the model for such a long
                            J-8        84           180
                                                                          time? Do you feel that 300 h is too long or too short a
                            J-9        88           151
                                                                          time period for testing the model? Why?
                                Table 7.32  Results Table for Problem 7.8
                                Junction       J-1   J-2   J-3  J-4   J-5   J-6   J-7  J-8   J-9   T-1
                                Age (h)
                                Chlorine
                                Concentration
                                (mg/L)
   298   299   300   301   302   303   304   305   306   307   308