
Page 299 - Fair, Geyer, and Okun's Water and wastewater engineering : water supply and wastewater removal
P. 299
JWCL344_ch07_230-264.qxd 8/2/10 8:44 PM Page 259
Problems/Questions 259
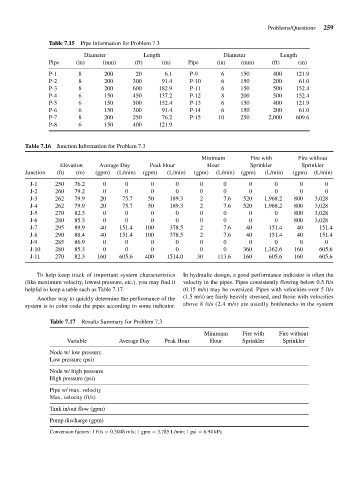
Table 7.15 Pipe Information for Problem 7.3
Diameter Length Diameter Length
Pipe (in) (mm) (ft) (m) Pipe (in) (mm) (ft) (m)
P-1 8 200 20 6.1 P-9 6 150 400 121.9
P-2 8 200 300 91.4 P-10 6 150 200 61.0
P-3 8 200 600 182.9 P-11 6 150 500 152.4
P-4 6 150 450 137.2 P-12 8 200 500 152.4
P-5 6 150 500 152.4 P-13 6 150 400 121.9
P-6 6 150 300 91.4 P-14 6 150 200 61.0
P-7 8 200 250 76.2 P-15 10 250 2,000 609.6
P-8 6 150 400 121.9
Table 7.16 Junction Information for Problem 7.3
Minimum Fire with Fire without
Elevation Average Day Peak Hour Hour Sprinkler Sprinkler
Junction (ft) (m) (gpm) (L/min) (gpm) (L/min) (gpm) (L/min) (gpm) (L/min) (gpm) (L/min)
J-1 250 76.2 0 0 0 0 0 0 0 0 0 0
J-2 260 79.2 0 0 0 0 0 0 0 0 0 0
J-3 262 79.9 20 75.7 50 189.3 2 7.6 520 1,968.2 800 3,028
J-4 262 79.9 20 75.7 50 189.3 2 7.6 520 1,968.2 800 3,028
J-5 270 82.3 0 0 0 0 0 0 0 0 800 3,028
J-6 280 85.3 0 0 0 0 0 0 0 0 800 3,028
J-7 295 89.9 40 151.4 100 378.5 2 7.6 40 151.4 40 151.4
J-8 290 88.4 40 151.4 100 378.5 2 7.6 40 151.4 40 151.4
J-9 285 86.9 0 0 0 0 0 0 0 0 0 0
J-10 280 85.3 0 0 0 0 0 0 360 1,362.6 160 605.6
J-11 270 82.3 160 605.6 400 1514.0 30 113.6 160 605.6 160 605.6
To help keep track of important system characteristics In hydraulic design, a good performance indicator is often the
(like maximum velocity, lowest pressure, etc.), you may find it velocity in the pipes. Pipes consistently flowing below 0.5 ft/s
helpful to keep a table such as Table 7.17. (0.15 m/s) may be oversized. Pipes with velocities over 5 ft/s
Another way to quickly determine the performance of the (1.5 m/s) are fairly heavily stressed, and those with velocities
system is to color-code the pipes according to some indicator. above 8 ft/s (2.4 m/s) are usually bottlenecks in the system
Table 7.17 Results Summary for Problem 7.3
Minimum Fire with Fire without
Variable Average Day Peak Hour Hour Sprinkler Sprinkler
Node w/ low pressure
Low pressure (psi)
Node w/ high pressure
High pressure (psi)
Pipe w/ max. velocity
Max. velocity (ft/s)
Tank in/out flow (gpm)
Pump discharge (gpm)
Conversion factors: 1 ft/s 0.3048 m/s; 1 gpm 3.785 L/min; 1 psi 6.94 kPa