Page 416 - Fair, Geyer, and Okun's Water and wastewater engineering : water supply and wastewater removal
P. 416

JWCL344_ch11_357-397.qxd  8/2/10  9:01 PM  Page 376


                    376  Chapter 11  Hydrology: Rainfall and Runoff
                                                   Table 11.2  Associations in Arithmetic and Geometric Probability Plots

                                                                               Observed or Derived Magnitude
                                                   Observed or Derived
                                                   Frequency (%)             Arithmetic         Geometric
                                                   50                        m                  m g
                                                   84.1                      m + s              m g * s g
                                                   15.9                      m - s              m g /s g


                                         variable for some other functionally Gaussian normality. Observations that have a
                                         lower limit at or near zero may be geometrically normal (log 0    q ).
                                             Helpful and useful associations in arithmetic and geometric probability plots can be
                                         listed as shown in Table 11.2.
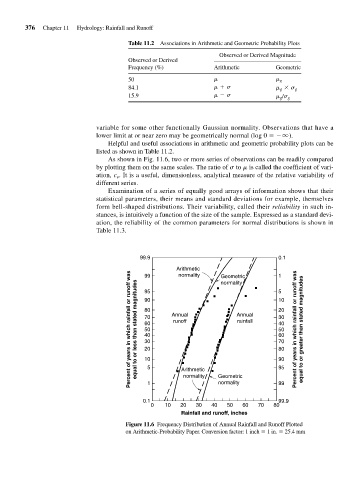
                                             As shown in Fig. 11.6, two or more series of observations can be readily compared
                                         by plotting them on the same scales. The ratio of s to m is called the coefficient of vari-
                                         ation, c . It is a useful, dimensionless, analytical measure of the relative variability of
                                                v
                                         different series.
                                             Examination of a series of equally good arrays of information shows that their
                                         statistical parameters, their means and standard deviations for example, themselves
                                         form bell-shaped distributions. Their variability, called their reliability in such in-
                                         stances, is intuitively a function of the size of the sample. Expressed as a standard devi-
                                         ation, the reliability of the common parameters for normal distributions is shown in
                                         Table 11.3.


                                                       99.9                                      0.1
                                                                  Arithmetic
                                                        99        normality    Geometric         1
                                                      equal to or less than stated magnitudes Percent of years in which rainfall or runoff was  80  Annual  Annual  20 Percent of years in which rainfall or runoff was equal to or greater than stated magnitudes
                                                                               normality
                                                                                                 5
                                                        95
                                                                                                 10
                                                        90
                                                                                                 30
                                                        70
                                                                 runoff
                                                                                    rainfall
                                                                                                 40
                                                        60
                                                        50
                                                                                                 50
                                                        40
                                                                                                 60
                                                        30
                                                                                                 70
                                                                                                 80
                                                        20
                                                        10
                                                                                                 95
                                                                    normality
                                                                              normality
                                                         1 5       Arithmetic  Geometric         90
                                                                                                 99
                                                        0.1                                      99.9
                                                          0   10   20   30  40   50   60   70  80
                                                                   Rainfall and runoff, inches
                                                  Figure 11.6 Frequency Distribution of Annual Rainfall and Runoff Plotted
                                                  on Arithmetic-Probability Paper. Conversion factor: 1 inch   1 in.   25.4 mm
   411   412   413   414   415   416   417   418   419   420   421