
Page 417 - Fair, Geyer, and Okun's Water and wastewater engineering : water supply and wastewater removal
P. 417
JWCL344_ch11_357-397.qxd 8/2/10 9:01 PM Page 377
11.12 Annual Rainfall and Runoff 377
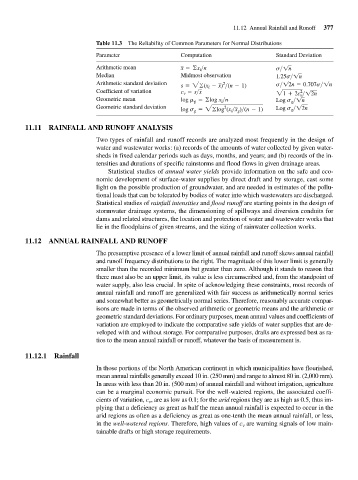
Table 11.3 The Reliability of Common Parameters for Normal Distributions
Parameter Computation Standard Deviation
Arithmetic mean x =©x i >n s>1n
Median Midmost observation 1.25s>1n
Arithmetic standard deviation 2 s>12n = 0.707s>1n
s = 2©(x i - x) >(n - 1)
Coefficient of variation c v = s>x 21 + 2c v > 12n
2
Geometric mean log m g =©log x i >n Log s g >1n
Geometric standard deviation 2 Log s g >12n
log s g = 2©log (x i >x g )>(n - 1)
11.11 RAINFALL AND RUNOFF ANALYSIS
Two types of rainfall and runoff records are analyzed most frequently in the design of
water and wastewater works: (a) records of the amounts of water collected by given water-
sheds in fixed calendar periods such as days, months, and years; and (b) records of the in-
tensities and durations of specific rainstorms and flood flows in given drainage areas.
Statistical studies of annual water yields provide information on the safe and eco-
nomic development of surface-water supplies by direct draft and by storage, cast some
light on the possible production of groundwater, and are needed in estimates of the pollu-
tional loads that can be tolerated by bodies of water into which wastewaters are discharged.
Statistical studies of rainfall intensities and flood runoff are starting points in the design of
stormwater drainage systems, the dimensioning of spillways and diversion conduits for
dams and related structures, the location and protection of water and wastewater works that
lie in the floodplains of given streams, and the sizing of rainwater collection works.
11.12 ANNUAL RAINFALL AND RUNOFF
The presumptive presence of a lower limit of annual rainfall and runoff skews annual rainfall
and runoff frequency distributions to the right. The magnitude of this lower limit is generally
smaller than the recorded minimum but greater than zero. Although it stands to reason that
there must also be an upper limit, its value is less circumscribed and, from the standpoint of
water supply, also less crucial. In spite of acknowledging these constraints, most records of
annual rainfall and runoff are generalized with fair success as arithmetically normal series
and somewhat better as geometrically normal series. Therefore, reasonably accurate compar-
isons are made in terms of the observed arithmetic or geometric means and the arithmetic or
geometric standard deviations. For ordinary purposes, mean annual values and coefficients of
variation are employed to indicate the comparative safe yields of water supplies that are de-
veloped with and without storage. For comparative purposes, drafts are expressed best as ra-
tios to the mean annual rainfall or runoff, whatever the basis of measurement is.
11.12.1 Rainfall
In those portions of the North American continent in which municipalities have flourished,
mean annual rainfalls generally exceed 10 in. (250 mm) and range to almost 80 in. (2,000 mm).
In areas with less than 20 in. (500 mm) of annual rainfall and without irrigation, agriculture
can be a marginal economic pursuit. For the well-watered regions, the associated coeffi-
cients of variation, c , are as low as 0.1; for the arid regions they are as high as 0.5, thus im-
v
plying that a deficiency as great as half the mean annual rainfall is expected to occur in the
arid regions as often as a deficiency as great as one-tenth the mean annual rainfall, or less,
in the well-watered regions. Therefore, high values of c are warning signals of low main-
v
tainable drafts or high storage requirements.