
Page 420 - Fair, Geyer, and Okun's Water and wastewater engineering : water supply and wastewater removal
P. 420
JWCL344_ch11_357-397.qxd 8/2/10 9:01 PM Page 380
380 Chapter 11 Hydrology: Rainfall and Runoff
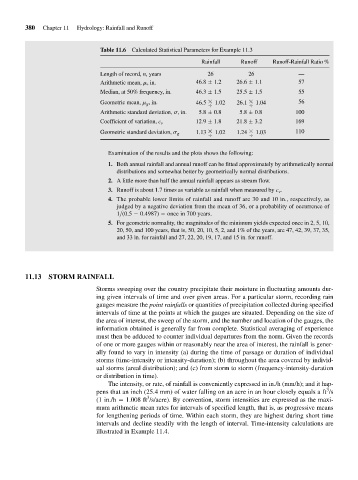
Table 11.6 Calculated Statistical Parameters for Example 11.3
Rainfall Runoff Runoff-Rainfall Ratio %
Length of record, n, years 26 26 —
Arithmetic mean, m, in. 46.8 ; 1.2 26.6 ; 1.1 57
Median, at 50% frequency, in. 46.3 ; 1.5 25.5 ; 1.5 55
Geometric mean, m g , in. 46.5 * 1.02 26.1 * 1.04 56
, ,
Arithmetic standard deviation, s, in. 5.8 ; 0.8 5.8 ; 0.8 100
Coefficient of variation, c v 12.9 ; 1.8 21.8 ; 3.2 169
Geometric standard deviation, s g 1.13 * 1.02 1.24 * 1.03 110
, ,
Examination of the results and the plots shows the following:
1. Both annual rainfall and annual runoff can be fitted approximately by arithmetically normal
distributions and somewhat better by geometrically normal distributions.
2. A little more than half the annual rainfall appears as stream flow.
3. Runoff is about 1.7 times as variable as rainfall when measured by c v .
4. The probable lower limits of rainfall and runoff are 30 and 10 in., respectively, as
judged by a negative deviation from the mean of 36, or a probability of occurrence of
1>(0.5 0.4987) once in 700 years.
5. For geometric normality, the magnitudes of the minimum yields expected once in 2, 5, 10,
20, 50, and 100 years, that is, 50, 20, 10, 5, 2, and 1% of the years, are 47, 42, 39, 37, 35,
and 33 in. for rainfall and 27, 22, 20, 19, 17, and 15 in. for runoff.
11.13 STORM RAINFALL
Storms sweeping over the country precipitate their moisture in fluctuating amounts dur-
ing given intervals of time and over given areas. For a particular storm, recording rain
gauges measure the point rainfalls or quantities of precipitation collected during specified
intervals of time at the points at which the gauges are situated. Depending on the size of
the area of interest, the sweep of the storm, and the number and location of the gauges, the
information obtained is generally far from complete. Statistical averaging of experience
must then be adduced to counter individual departures from the norm. Given the records
of one or more gauges within or reasonably near the area of interest, the rainfall is gener-
ally found to vary in intensity (a) during the time of passage or duration of individual
storms (time-intensity or intensity-duration); (b) throughout the area covered by individ-
ual storms (areal distribution); and (c) from storm to storm (frequency-intensity-duration
or distribution in time).
The intensity, or rate, of rainfall is conveniently expressed in in./h (mm/h); and it hap-
3
pens that an inch (25.4 mm) of water falling on an acre in an hour closely equals a ft /s
3
(1 in./h 1.008 ft /s/acre). By convention, storm intensities are expressed as the maxi-
mum arithmetic mean rates for intervals of specified length, that is, as progressive means
for lengthening periods of time. Within each storm, they are highest during short time
intervals and decline steadily with the length of interval. Time-intensity calculations are
illustrated in Example 11.4.