
Page 418 - Fair, Geyer, and Okun's Water and wastewater engineering : water supply and wastewater removal
P. 418
JWCL344_ch11_357-397.qxd 8/2/10 9:01 PM Page 378
378 Chapter 11 Hydrology: Rainfall and Runoff
11.12.2 Runoff
Evaporation and transpiration, together with unrecovered infiltration into the ground, reduce
annual runoff below annual rainfall. Seasonally, however, the distribution of rainfall and runoff
may vary so widely that it is impossible to establish a direct and meaningful relationship be-
tween the two. On the North American continent, the mean annual runoff from catchment areas
for water supplies ranges from about 5 to 40 in. (127 to 1,000 mm) and the coefficient of varia-
tion of runoff lies between 0.75 and 0.15, respectively. The fact that the mean annual runoff is
usually less than half the mean annual rainfall and the variation in stream flow is about half
again as great as the variation in precipitation militates against the establishment of direct
runoff-rainfall ratios. Storage of winter snows and resulting summer snowmelts offer an impor-
tant example of conflict between seasonal precipitation and runoff.
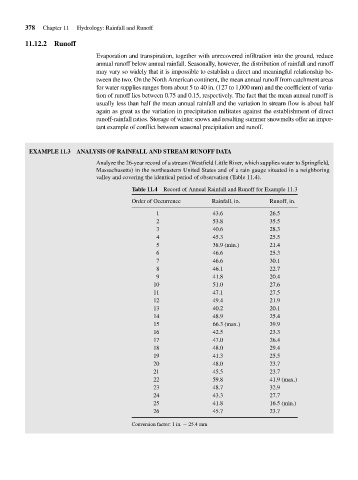
EXAMPLE 11.3 ANALYSIS OF RAINFALL AND STREAM RUNOFF DATA
Analyze the 26-year record of a stream (Westfield Little River, which supplies water to Springfield,
Massachusetts) in the northeastern United States and of a rain gauge situated in a neighboring
valley and covering the identical period of observation (Table 11.4).
Table 11.4 Record of Annual Rainfall and Runoff for Example 11.3
Order of Occurrence Rainfall, in. Runoff, in.
1 43.6 26.5
2 53.8 35.5
3 40.6 28.3
4 45.3 25.5
5 38.9 (min.) 21.4
6 46.6 25.3
7 46.6 30.1
8 46.1 22.7
9 41.8 20.4
10 51.0 27.6
11 47.1 27.5
12 49.4 21.9
13 40.2 20.1
14 48.9 25.4
15 66.3 (max.) 39.9
16 42.5 23.3
17 47.0 26.4
18 48.0 29.4
19 41.3 25.5
20 48.0 23.7
21 45.5 23.7
22 59.8 41.9 (max.)
23 48.7 32.9
24 43.3 27.7
25 41.8 16.5 (min.)
26 45.7 23.7
Conversion factor: 1 in. 25.4 mm