
Page 421 - Fair, Geyer, and Okun's Water and wastewater engineering : water supply and wastewater removal
P. 421
JWCL344_ch11_357-397.qxd 8/27/10 2:44 PM Page 381
11.14 Frequency of Intense Storms 381
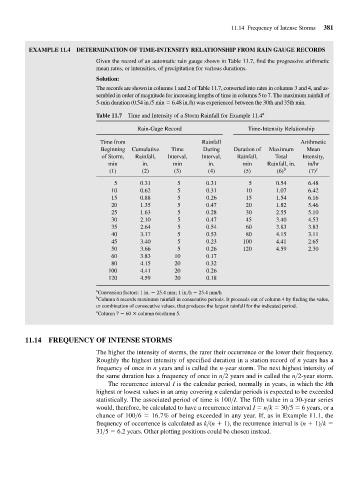
EXAMPLE 11.4 DETERMINATION OF TIME-INTENSITY RELATIONSHIP FROM RAIN GAUGE RECORDS
Given the record of an automatic rain gauge shown in Table 11.7, find the progressive arithmetic
mean rates, or intensities, of precipitation for various durations.
Solution:
The records are shown in columns 1 and 2 of Table 11.7, converted into rates in columns 3 and 4, and as-
sembled in order of magnitude for increasing lengths of time in columns 5 to 7. The maximum rainfall of
5-min duration (0.54 in./5 min 6.48 in./h) was experienced between the 30th and 35th min.
Table 11.7 Time and Intensity of a Storm Rainfall for Example 11.4 a
Rain-Gage Record Time-Intensity Relationship
Time from Rainfall Arithmetic
Beginning Cumulative Time During Duration of Maximum Mean
of Storm, Rainfall, Interval, Interval, Rainfall, Total Intensity,
min in. min in. min Rainfall, in. in/hr
(1) (2) (3) (4) (5) (6) b (7) c
5 0.31 5 0.31 5 0.54 6.48
10 0.62 5 0.31 10 1.07 6.42
15 0.88 5 0.26 15 1.54 6.16
20 1.35 5 0.47 20 1.82 5.46
25 1.63 5 0.28 30 2.55 5.10
30 2.10 5 0.47 45 3.40 4.53
35 2.64 5 0.54 60 3.83 3.83
40 3.17 5 0.53 80 4.15 3.11
45 3.40 5 0.23 100 4.41 2.65
50 3.66 5 0.26 120 4.59 2.30
60 3.83 10 0.17
80 4.15 20 0.32
100 4.41 20 0.26
120 4.59 20 0.18
a
Conversion factors: 1 in. 25.4 mm; 1 in./h 25.4 mm/h
b
Column 6 records maximum rainfall in consecutive periods. It proceeds out of column 4 by finding the value,
or combination of consecutive values, that produces the largest rainfall for the indicated period.
c
Column 7 60 column 6/column 5.
11.14 FREQUENCY OF INTENSE STORMS
The higher the intensity of storms, the rarer their occurrence or the lower their frequency.
Roughly the highest intensity of specified duration in a station record of n years has a
frequency of once in n years and is called the n-year storm. The next highest intensity of
the same duration has a frequency of once in n>2 years and is called the n>2-year storm.
The recurrence interval I is the calendar period, normally in years, in which the kth
highest or lowest values in an array covering n calendar periods is expected to be exceeded
statistically. The associated period of time is 100>I. The fifth value in a 30-year series
would, therefore, be calculated to have a recurrence interval I n>k 30>5 6 years, or a
chance of 100>6 16.7% of being exceeded in any year. If, as in Example 11.1, the
frequency of occurrence is calculated as k>(n 1), the recurrence interval is (n 1)>k
31>5 6.2 years. Other plotting positions could be chosen instead.