
Page 419 - Fair, Geyer, and Okun's Water and wastewater engineering : water supply and wastewater removal
P. 419
JWCL344_ch11_357-397.qxd 8/2/10 9:01 PM Page 379
11.12 Annual Rainfall and Runoff 379
Solution:
To plot the data, use the following information: The length of each record is n 26 years; there-
fore, each year of record spans 100>26 3.85% of the experience. However, the arrays are plotted
on probability paper in Fig. 11.6 at 100 k/(n 1) (100 k/27)% in order to locate identical points
for the left-hand and right-hand probability scales. The resulting plotting observations are shown in
Table 11.5.
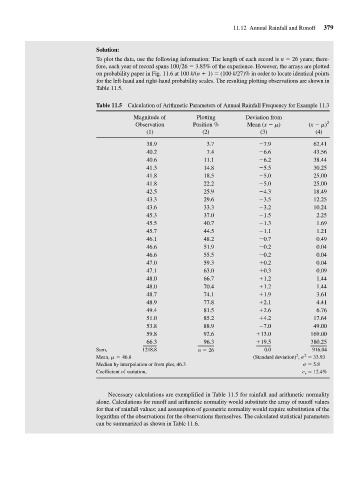
Table 11.5 Calculation of Arithmetic Parameters of Annual Rainfall Frequency for Example 11.3
Magnitude of Plotting Deviation from
Observation Position % Mean (x m) (x - m) 2
(1) (2) (3) (4)
38.9 3.7 - 7.9 62.41
40.2 7.4 - 6.6 43.56
40.6 11.1 - 6.2 38.44
41.3 14.8 - 5.5 30.25
41.8 18.5 - 5.0 25.00
41.8 22.2 - 5.0 25.00
42.5 25.9 - 4.3 18.49
43.3 29.6 - 3.5 12.25
43.6 33.3 - 3.2 10.24
45.3 37.0 - 1.5 2.25
45.5 40.7 - 1.3 1.69
45.7 44.5 - 1.1 1.21
46.1 48.2 - 0.7 0.49
46.6 51.9 - 0.2 0.04
46.6 55.5 - 0.2 0.04
47.0 59.3 + 0.2 0.04
47.1 63.0 + 0.3 0.09
48.0 66.7 + 1.2 1.44
48.0 70.4 + 1.2 1.44
48.7 74.1 + 1.9 3.61
48.9 77.8 + 2.1 4.41
49.4 81.5 + 2.6 6.76
51.0 85.2 + 4.2 17.64
53.8 88.9 - 7.0 49.00
59.8 92.6 + 13.0 169.00
66.3 96.3 + 19.5 380.25
Sum, 1218.8 n = 26 0.0 916.04
2
2
Mean, m = 46.8 (Standard deviation) , s = 33.93
Median by interpolation or from plot, 46.3 s = 5.8
Coefficient of variation, c v = 12.4%
Necessary calculations are exemplified in Table 11.5 for rainfall and arithmetic normality
alone. Calculations for runoff and arithmetic normality would substitute the array of runoff values
for that of rainfall values; and assumption of geometric normality would require substitution of the
logarithm of the observations for the observations themselves. The calculated statistical parameters
can be summarized as shown in Table 11.6.